
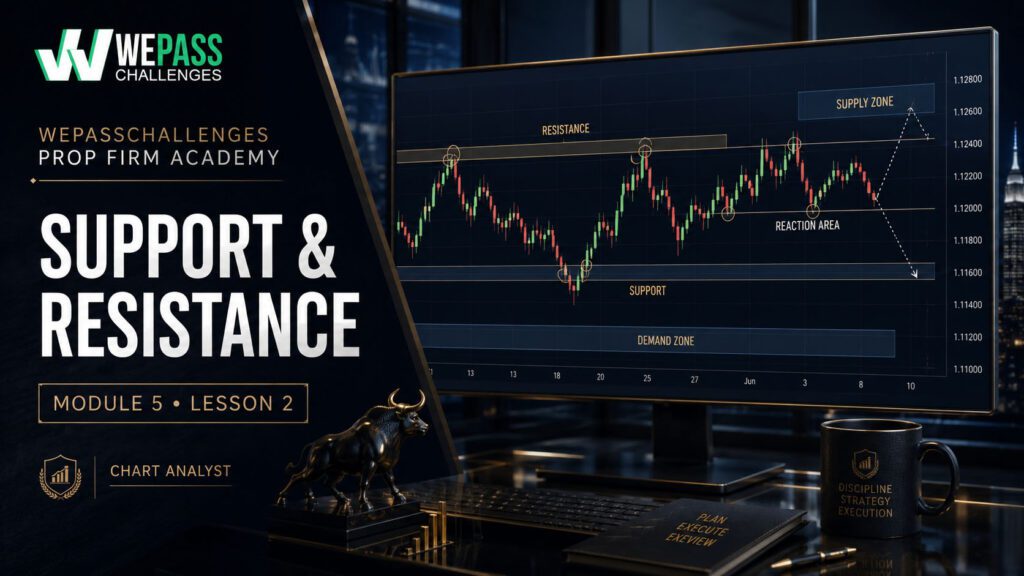
Support & Resistance
Learn how professional traders identify the price zones where the market is most likely to react, reject, pause, or break.
Learning Objectives
- Understand what support and resistance actually represent.
- Identify clean horizontal levels on any chart.
- Separate important zones from random chart noise.
- Understand supply, demand, and reaction areas.
- Use support and resistance with prop firm risk rules.
- Avoid chasing trades directly into major levels.
- Build a cleaner technical analysis process before entering trades.
- Connect levels with market structure, confirmation, and risk management.
What Are Support & Resistance?
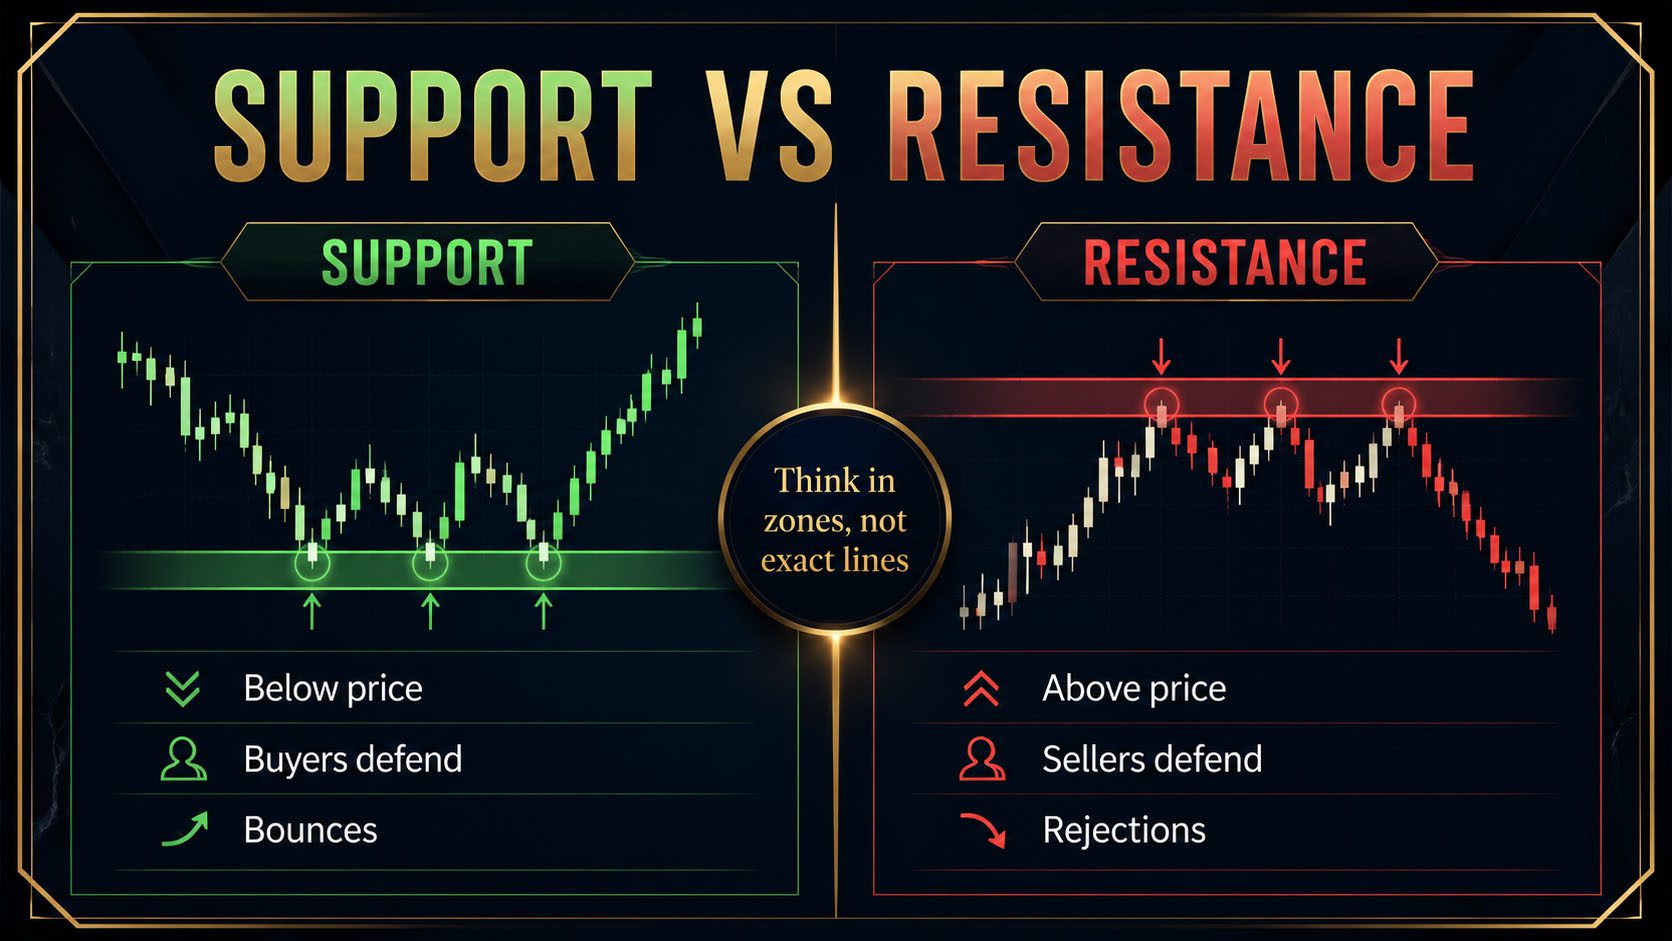
Support and resistance are areas on the chart where price has reacted before and may react again. These zones matter because they show where buyers or sellers previously stepped in with enough force to change the direction of price.
Support
Support is an area below current price where buying pressure may appear. It is not a magic line. It is a zone where traders previously saw value and pushed price higher.
Resistance
Resistance is an area above current price where selling pressure may appear. It is where traders previously rejected higher prices and forced the market lower.
Support and resistance should never be studied alone. They work best when combined with market structure, market context, and clear risk rules. A level matters more when the broader chart agrees with it.
Horizontal Levels
The cleanest support and resistance levels are usually horizontal. These are price areas where the market has reacted multiple times.
How to Find a Quality Level
- Look for areas where price clearly reversed.
- Focus on levels visible without forcing the chart.
- Prioritize recent reactions over old, irrelevant ones.
- Mark zones where price reacted with strong momentum.
- Avoid drawing too many levels.
A clean level should help you make a decision faster, not make the chart more confusing. This is why professional traders combine key levels with a simple technical analysis framework instead of marking every wick on the chart.
Supply & Demand Zones
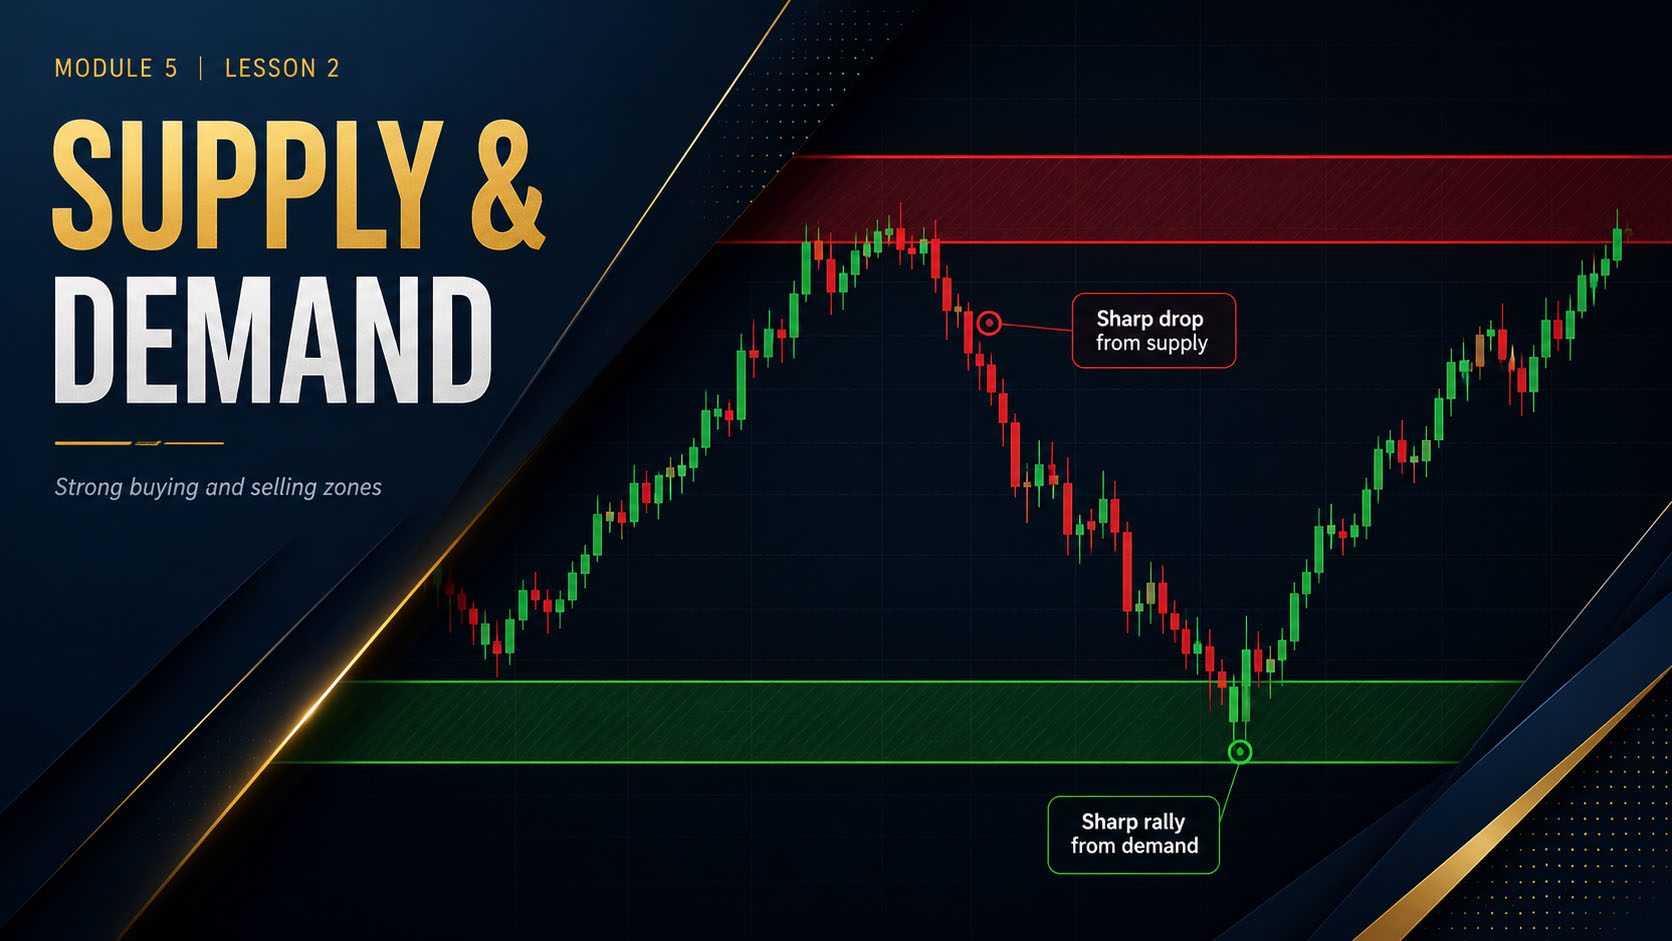
Supply and demand zones are wider areas where institutions, larger traders, or heavy order flow may have entered the market.
Demand Zone
A demand zone forms where strong buying caused price to move higher. When price returns, buyers may defend that area again.
Supply Zone
A supply zone forms where strong selling caused price to drop. When price returns, sellers may defend that area again.
| Zone Type | Meaning | Trader Focus |
|---|---|---|
| Support | Price may bounce higher. | Look for bullish reaction. |
| Resistance | Price may reject lower. | Look for bearish reaction. |
| Demand | Strong buyers entered. | Watch for continuation upward. |
| Supply | Strong sellers entered. | Watch for continuation downward. |
Supply and demand zones become stronger when they align with higher-timeframe bias. This is why traders should also study multi-timeframe analysis before relying on lower-timeframe reaction zones.
Key Reaction Zones
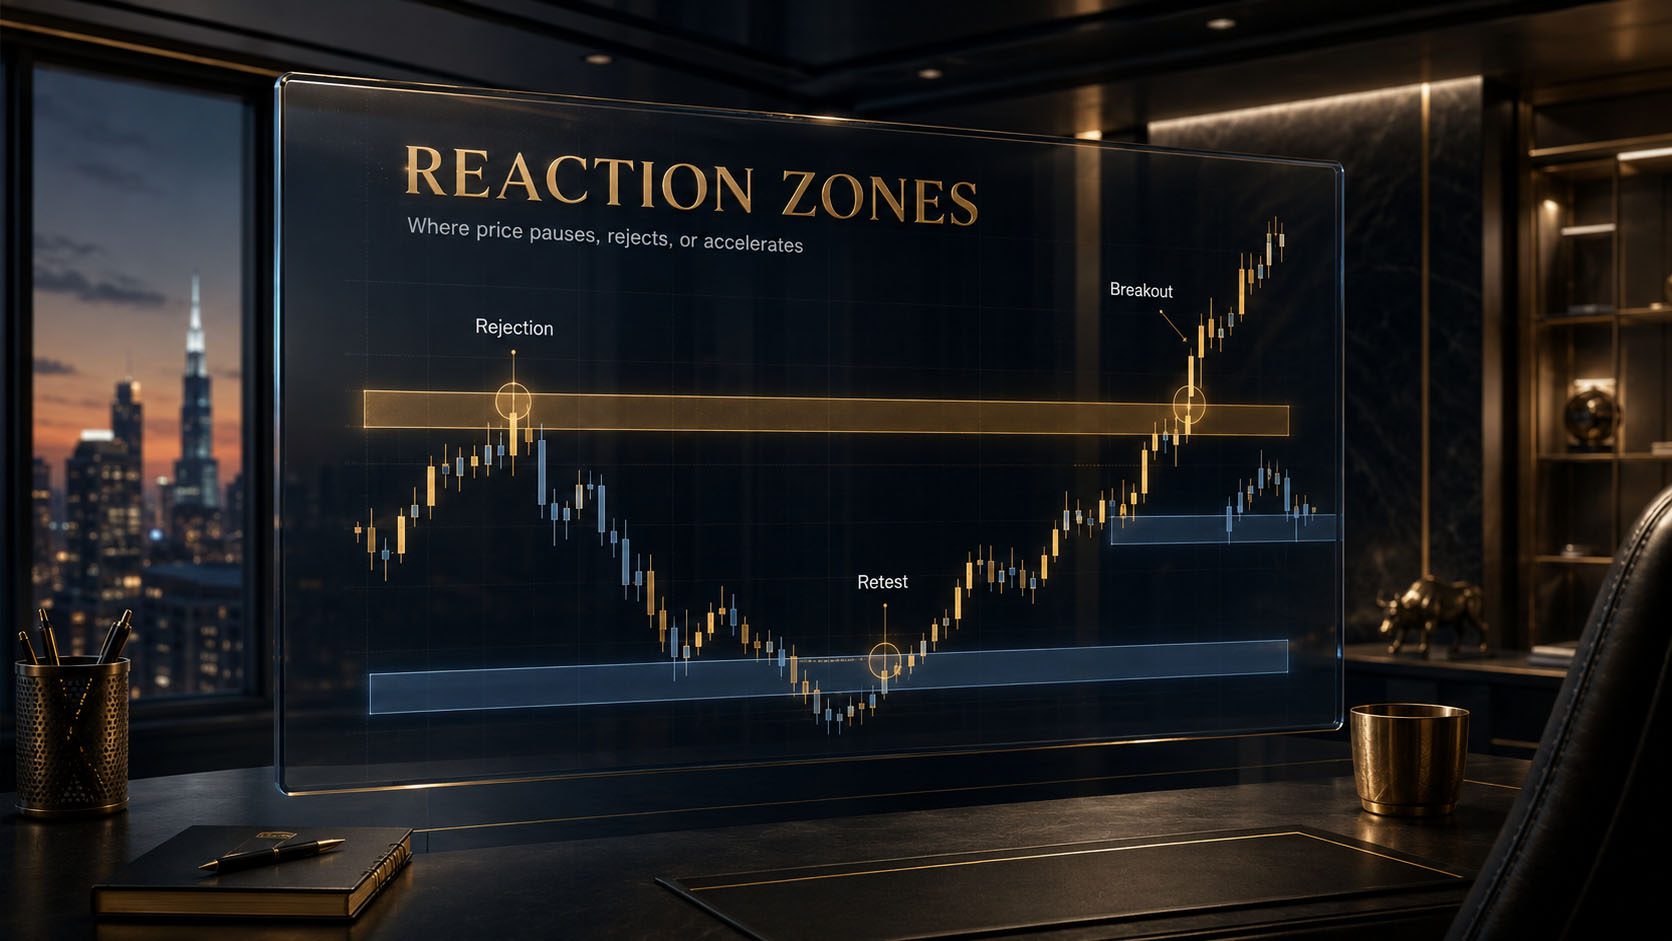
A key reaction zone is an area where price has shown meaningful behavior before. It could be a sharp rejection, a breakout, a retest, or a consolidation before a large move.
Strong Reaction Zones Usually Have:
- A sharp bounce or rejection.
- Multiple touches without being destroyed.
- High-volume or high-volatility movement away from the level.
- Alignment with market structure.
- Clear visibility on higher timeframes.
Reaction zones become much more useful when you wait for price behavior at the level. This is where candlestick patterns can help confirm whether buyers or sellers are actually responding.
Support Becomes Resistance
One of the most important concepts in technical analysis is role reversal. When support breaks, it can become resistance. When resistance breaks, it can become support.
Example
If EURUSD keeps bouncing from 1.0800, that area is support. If price breaks below 1.0800 and later retests it from underneath, that same level may now act as resistance.
Role reversal can help traders avoid emotional breakout entries. Instead of chasing price, wait for the retest, confirm the reaction, and make sure the setup still respects your risk-to-reward requirements.
Practical Trading Examples
XAUUSD Example
Gold rallies into a previous resistance zone near 2350. Price reaches the level, forms a strong bearish rejection candle, and fails to close above the zone.
A professional trader does not instantly sell just because price touched resistance. They wait for confirmation, such as rejection, lower-timeframe structure shift, or bearish continuation.
NASDAQ Example
NASDAQ breaks above a clean resistance level during New York session. Instead of chasing the breakout at the top, the trader waits for price to pull back into the old resistance.
If that area holds as support, the trader can plan a long entry with tighter risk and a cleaner invalidation point.
EURUSD Example
EURUSD moves sideways between support and resistance during low-volume hours. A beginner enters randomly in the middle. A professional trader waits for price to reach the edge of the range before making a decision.
Common Beginner Mistakes
- Drawing too many levels.
- Treating levels as exact prices instead of zones.
- Buying directly into resistance.
- Selling directly into support.
- Ignoring higher-timeframe levels.
- Entering before confirmation.
- Using support and resistance without a stop loss plan.
Many of these mistakes happen because traders are impatient. Review Patience Pays and Building Discipline if you struggle with entering too early or forcing trades at weak levels.
Professional Checklist
- Mark only the cleanest support and resistance zones.
- Start from higher timeframes before moving lower.
- Check whether price is near a major level before entering.
- Avoid entering directly into nearby opposing zones.
- Wait for confirmation before trading a reaction.
- Use zones to plan risk, not to guess blindly.
- Keep the chart clean enough to make fast decisions.
- Respect prop firm drawdown limits on every setup.
This checklist should be used with your written professional trading plan. Clean levels give you location; your plan tells you when risk is allowed.
How Support & Resistance Protect Prop Firm Accounts
Prop firm traders need more than good entries. They need controlled risk, clean trade location, and enough patience to avoid low-quality setups. Support and resistance help you filter trades before you put the account at risk.
Avoid Bad Location
Buying directly into resistance or selling directly into support gives the trade less room to work. Better location usually creates better reward-to-risk.
Protect Drawdown
Clean levels help traders avoid random entries that can stack losses and pressure daily drawdown.
FAQ
Are support and resistance levels exact prices?
No. They are zones. Price often overshoots, wicks through, or briefly breaks a level before reacting.
How many levels should I draw?
Only draw the levels that clearly matter. Usually, a clean chart with 3–6 important zones is more useful than a chart full of lines.
Should I trade every touch of support or resistance?
No. A touch is not a trade. You still need confirmation, risk planning, and proper context.
Do support and resistance work on all markets?
Yes, but they behave differently depending on volatility, session, liquidity, and instrument. XAUUSD and NASDAQ may move through zones more aggressively than EURUSD.
Why do levels stop working?
Levels weaken when they are tested too many times or when market conditions change. No level works forever.
Knowledge Quiz
- Support is usually found where?
Answer: Below price. - Resistance is an area where what may appear?
Answer: Sellers may appear. - Professionals usually treat levels as what?
Answer: Zones. - A demand zone shows what?
Answer: Strong buying. - A supply zone shows what?
Answer: Strong selling. - When resistance breaks and holds, it may become what?
Answer: Support. - The best levels are usually what?
Answer: Obvious. - Buying directly into resistance is usually what?
Answer: Risky. - A clean chart should usually have what?
Answer: Only useful zones. - Support and resistance should be used with what?
Answer: Risk management.
Key Takeaways
- Support and resistance are zones where price may react.
- Clean horizontal levels are the foundation of technical analysis.
- Supply and demand zones show where strong buying or selling previously entered.
- Support can become resistance, and resistance can become support.
- Do not enter trades blindly just because price touches a level.
- Wait for confirmation and manage risk like a funded trader.
- A clean chart beats a cluttered chart every time.
Lesson Summary
Support and resistance are key zones where price has reacted before and may react again. Professional traders use these zones to identify better trade location, avoid buying into resistance, avoid selling into support, and plan cleaner risk. The goal is not to trade every touch of a level. The goal is to wait for price to reach a meaningful area, confirm the reaction, and execute only when the setup makes sense inside the broader market structure.