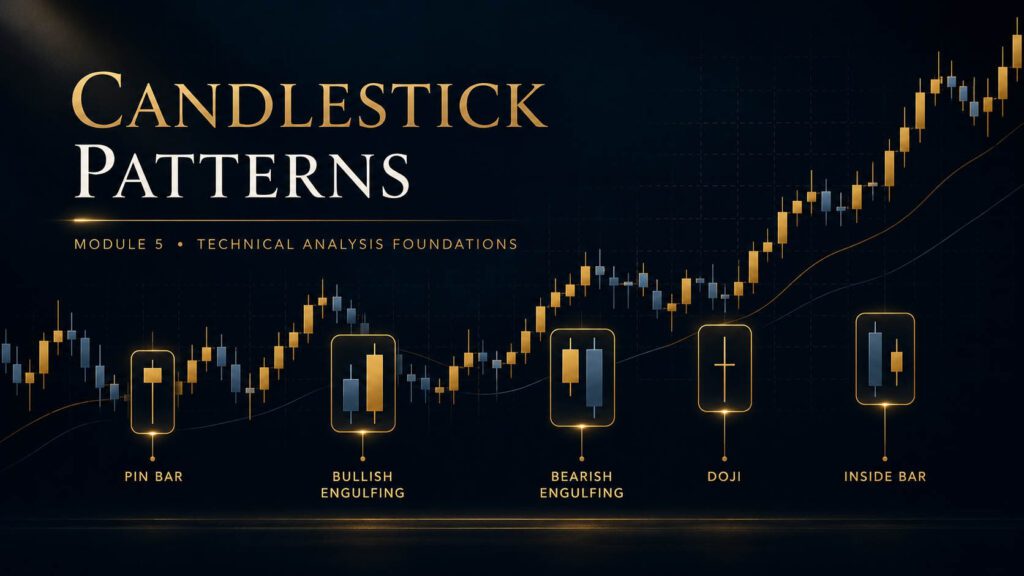
Candlestick Patterns
Master the language of price by learning how candles reveal momentum, rejection, indecision, and the battle between buyers and sellers.
Learning Objectives
- Understand what candlesticks actually represent.
- Read candles based on body size, wick size, and closing position.
- Identify continuation candles, reversal candles, and 50/50 candles.
- Understand why body-dominant candles show momentum.
- Understand why wick-dominant candles show rejection.
- Understand why doji-style candles show indecision.
- Use candles for confirmation, not blind prediction.
- Combine candlestick patterns with structure, levels, trend, and market context.
- Protect prop firm accounts by waiting for confirmation before risking capital.
What Candlesticks Really Show
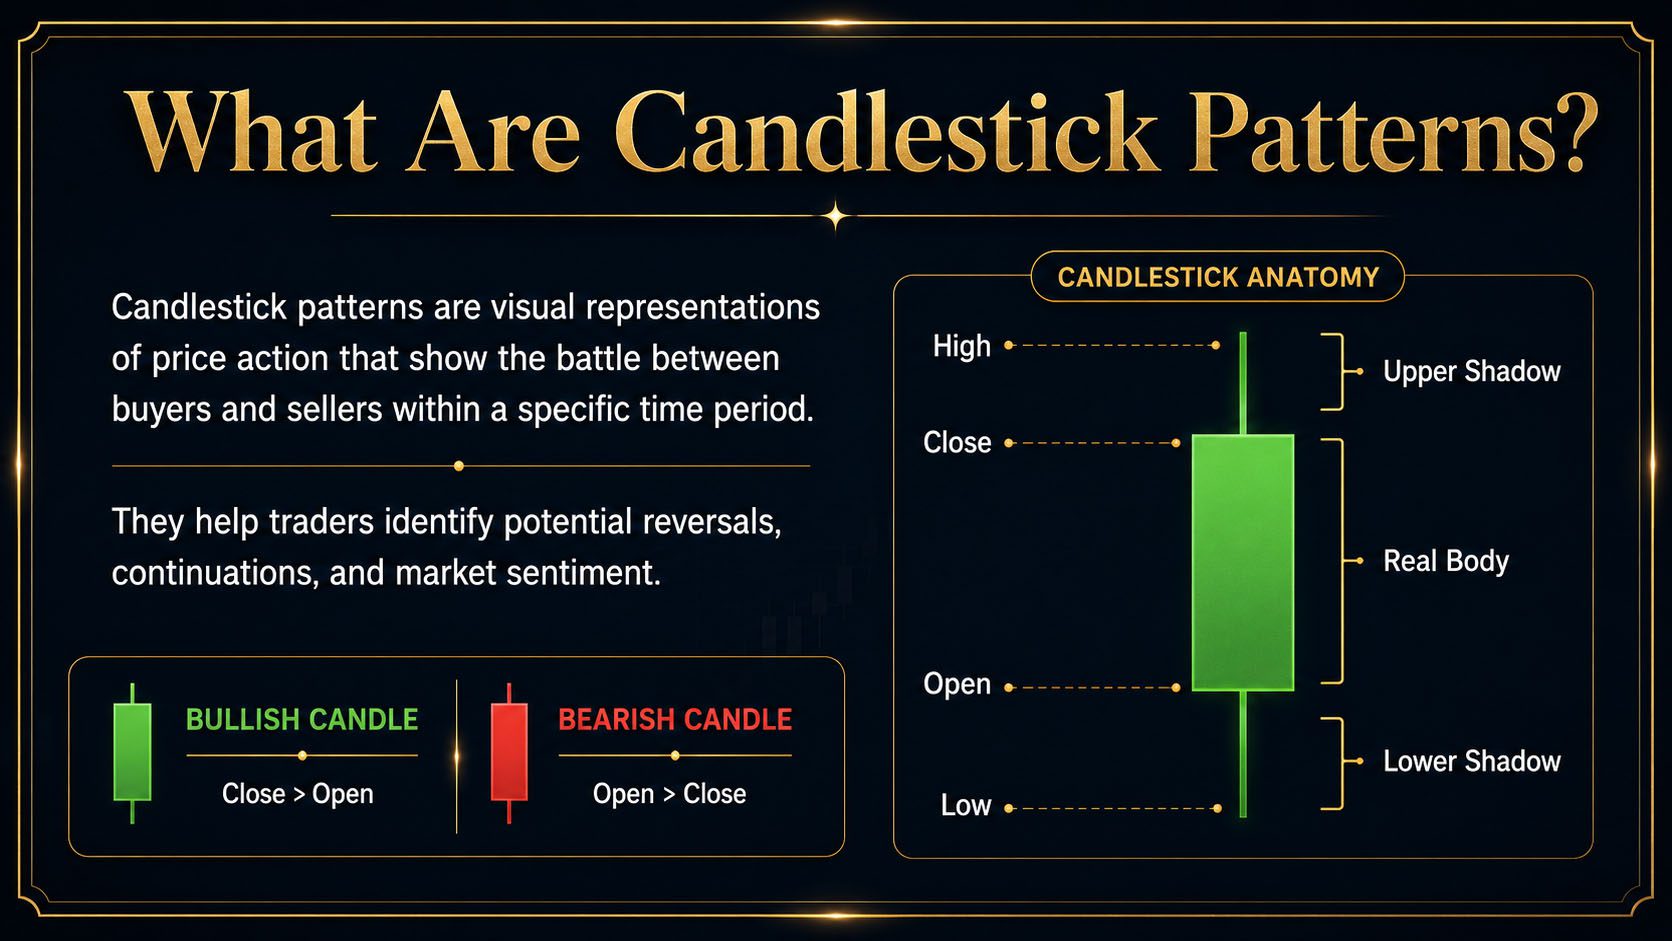
Candlesticks are visual representations of price action. Each candle shows what happened between buyers and sellers during a specific period of time. A candle can represent one minute, five minutes, one hour, one day, or any timeframe you are viewing.
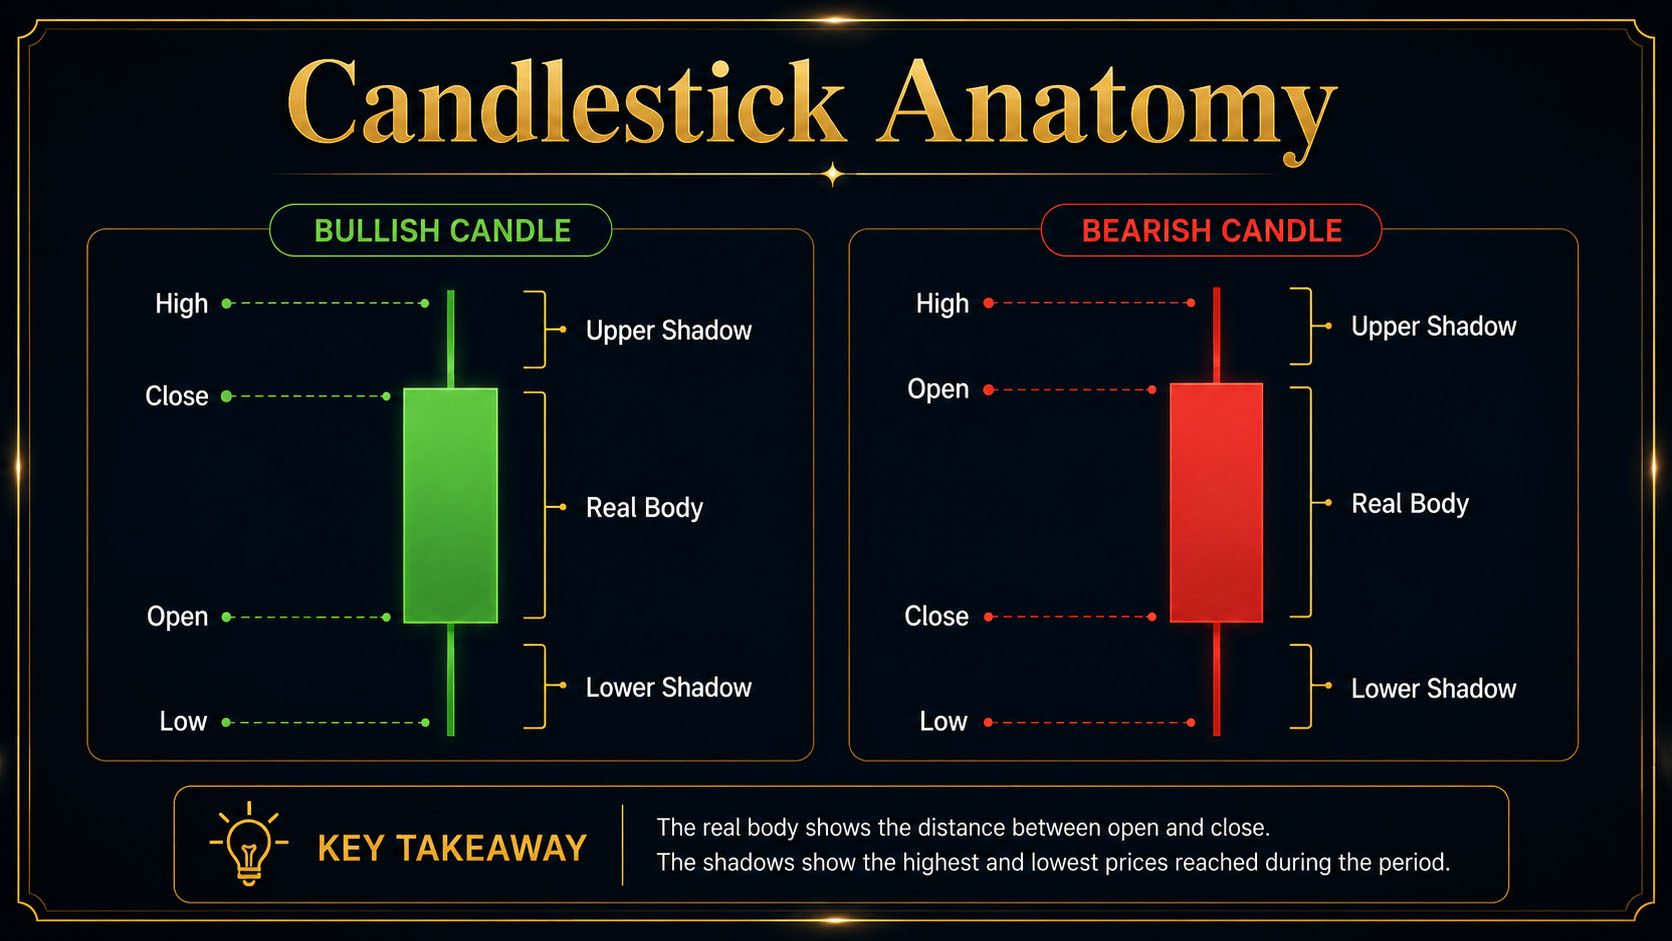
Every candle contains four important prices: the open, high, low, and close. The open shows where price started. The close shows where price finished. The high and low show how far price traveled before the candle ended.
Instead of memorizing dozens of random pattern names, professional traders focus on what the candle is actually saying. Is the candle showing strong momentum? Is it showing rejection? Is it showing indecision? That is what matters.
This is why candlestick patterns should be studied after market structure and support and resistance. The candle gives confirmation, but the chart location gives meaning.
Candlestick Anatomy
Before you can read patterns correctly, you need to understand the structure of a candle. The candle body and wick tell two different stories.
The Body
The body shows the distance between the open and close. A large body means one side had more control during that candle. A large bullish body shows buyers closed price strongly above the open. A large bearish body shows sellers closed price strongly below the open.
The Wick
The wick shows rejection. A long upper wick means price moved higher but sellers pushed it back down. A long lower wick means price moved lower but buyers pushed it back up.
The Close
The close is one of the most important parts of the candle. Where the candle closes tells you who won that candle. A strong close near the high suggests bullish pressure. A strong close near the low suggests bearish pressure. A weak close near the middle suggests indecision.
When candle anatomy lines up with a clean trendline or channel, the signal becomes more useful because you are reading both price action and structure together.
The 3 Main Types of Candles
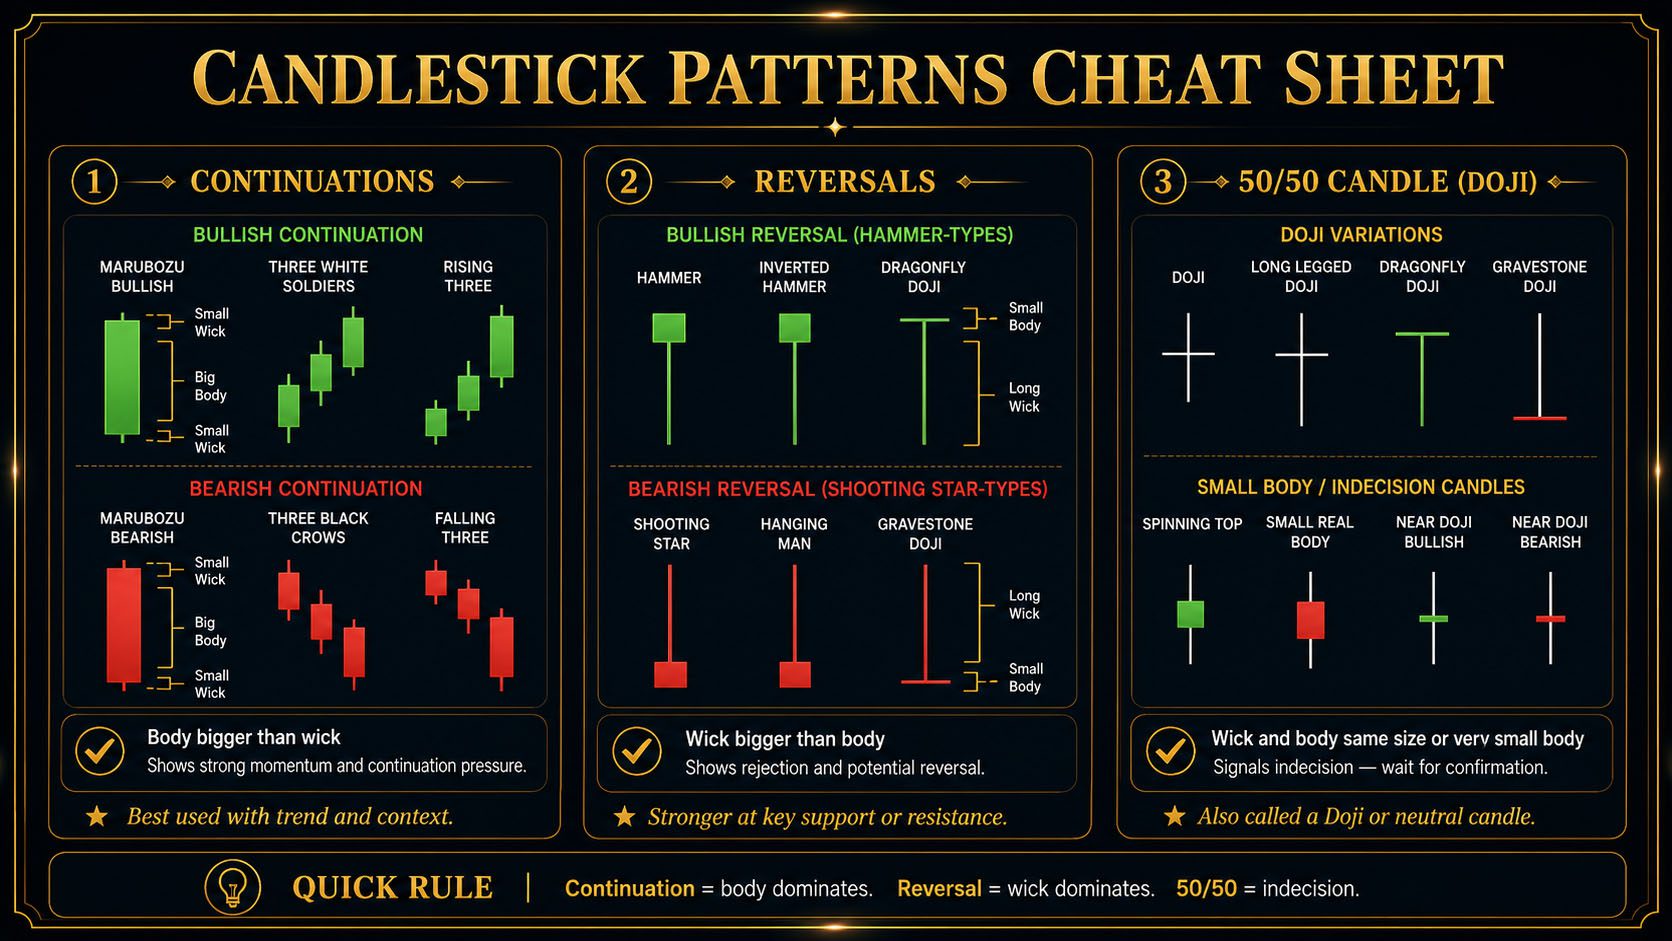
Instead of trying to memorize every candlestick name, simplify candles into three major categories. This makes candlestick reading much easier and more practical for real trading.
1. Continuation Candles
Continuation candles are candles where the body is bigger than the wick. These candles show momentum. They tell you that one side is pushing strongly and price is likely continuing in that direction.
A bullish continuation candle has a strong green body and small wicks. A bearish continuation candle has a strong red body and small wicks.
2. Reversal Candles
Reversal candles are candles where the wick is bigger than the body. These candles show rejection. Price tried to move in one direction, failed, and closed back the other way.
A long lower wick can show buyers rejected lower prices. A long upper wick can show sellers rejected higher prices.
3. 50/50 Candles
50/50 candles, also known as dojis or indecision candles, have small bodies and balanced wicks. They show hesitation between buyers and sellers.
These candles do not automatically mean reversal. They tell you the market is undecided and you should wait for more information.
Continuation Candles
Continuation candles are momentum candles. They usually have a large body and small wicks. The bigger the body compared to the wick, the stronger the momentum behind that candle.
When you see a strong bullish continuation candle, it means buyers controlled most of the candle. Price opened lower, pushed higher, and closed with strength. When you see a strong bearish continuation candle, it means sellers controlled most of the candle. Price opened higher, pushed lower, and closed with strength.
What Continuation Candles Suggest
- Strong momentum in one direction.
- Buyers or sellers clearly controlled the candle.
- Price may continue if the candle aligns with trend and structure.
- Best used when trading with the trend, not randomly against it.
Continuation candles become more reliable when they fit the broader market context. A momentum candle inside clean trend conditions is more meaningful than a momentum candle in choppy range conditions.
Reversal Candles
Reversal candles are rejection candles. These are candles where the wick is larger than the body. The wick tells you that price attempted to move in one direction but failed.
For example, if price drops into support and creates a candle with a long lower wick, that means sellers pushed price down but buyers stepped in and rejected the move. That can be a bullish reversal clue. If price rallies into resistance and creates a long upper wick, that means buyers pushed price up but sellers rejected the move. That can be a bearish reversal clue.
What Reversal Candles Suggest
- Price rejected a level.
- Momentum may be weakening.
- Buyers or sellers may be stepping in.
- A possible reversal or pullback may develop.
This is why rejection candles should be checked against multi-timeframe analysis. A bullish rejection candle on a lower timeframe may be weak if the higher timeframe is still strongly bearish.
50/50 Candles and Dojis
A 50/50 candle is a candle where neither buyers nor sellers clearly dominate. These candles usually have small bodies and balanced wicks. A doji is one of the most common examples.
These candles show indecision. Price moved during the candle, but by the close, neither side fully won. This can happen before a continuation, before a reversal, or during choppy market conditions.
What 50/50 Candles Suggest
- The market is pausing.
- Buyers and sellers are balanced.
- Momentum is unclear.
- The next candle often gives more useful information.
Dojis often appear in areas where patience matters. If the market is undecided, review Patience Pays instead of forcing a trade before the chart is ready.
How to Read Candles Like a Professional
Professional traders do not trade candles blindly. They read candles inside context. A strong candle in the wrong location can still be a bad trade. A reversal candle at a major level can be meaningful. A doji after a strong move may show hesitation, but it still needs confirmation.
| Candle Type | What It Shows | Best Location | Trader Action |
|---|---|---|---|
| Continuation Candle | Momentum | With trend after pullback | Look for continuation setups |
| Reversal Candle | Rejection | Support, resistance, supply, demand | Wait for confirmation |
| 50/50 Candle | Indecision | Key levels or after strong moves | Pause and wait |
This is the same idea behind the full technical analysis framework: no single signal should carry the entire trade idea by itself.
Confirmation Matters
Candlestick patterns do not work in isolation. A candle only becomes useful when it confirms something you already see in the market structure.
- A bullish rejection candle at support is meaningful.
- A bearish rejection candle at resistance is meaningful.
- A strong continuation candle after a pullback can confirm trend strength.
- A doji in the middle of nowhere is usually just noise.
- A candle pattern without context should usually be ignored.
Confirmation must still respect risk-to-reward. Even a beautiful candle pattern is not worth taking if the stop is too wide or the target is too close.
Practical Examples
XAUUSD
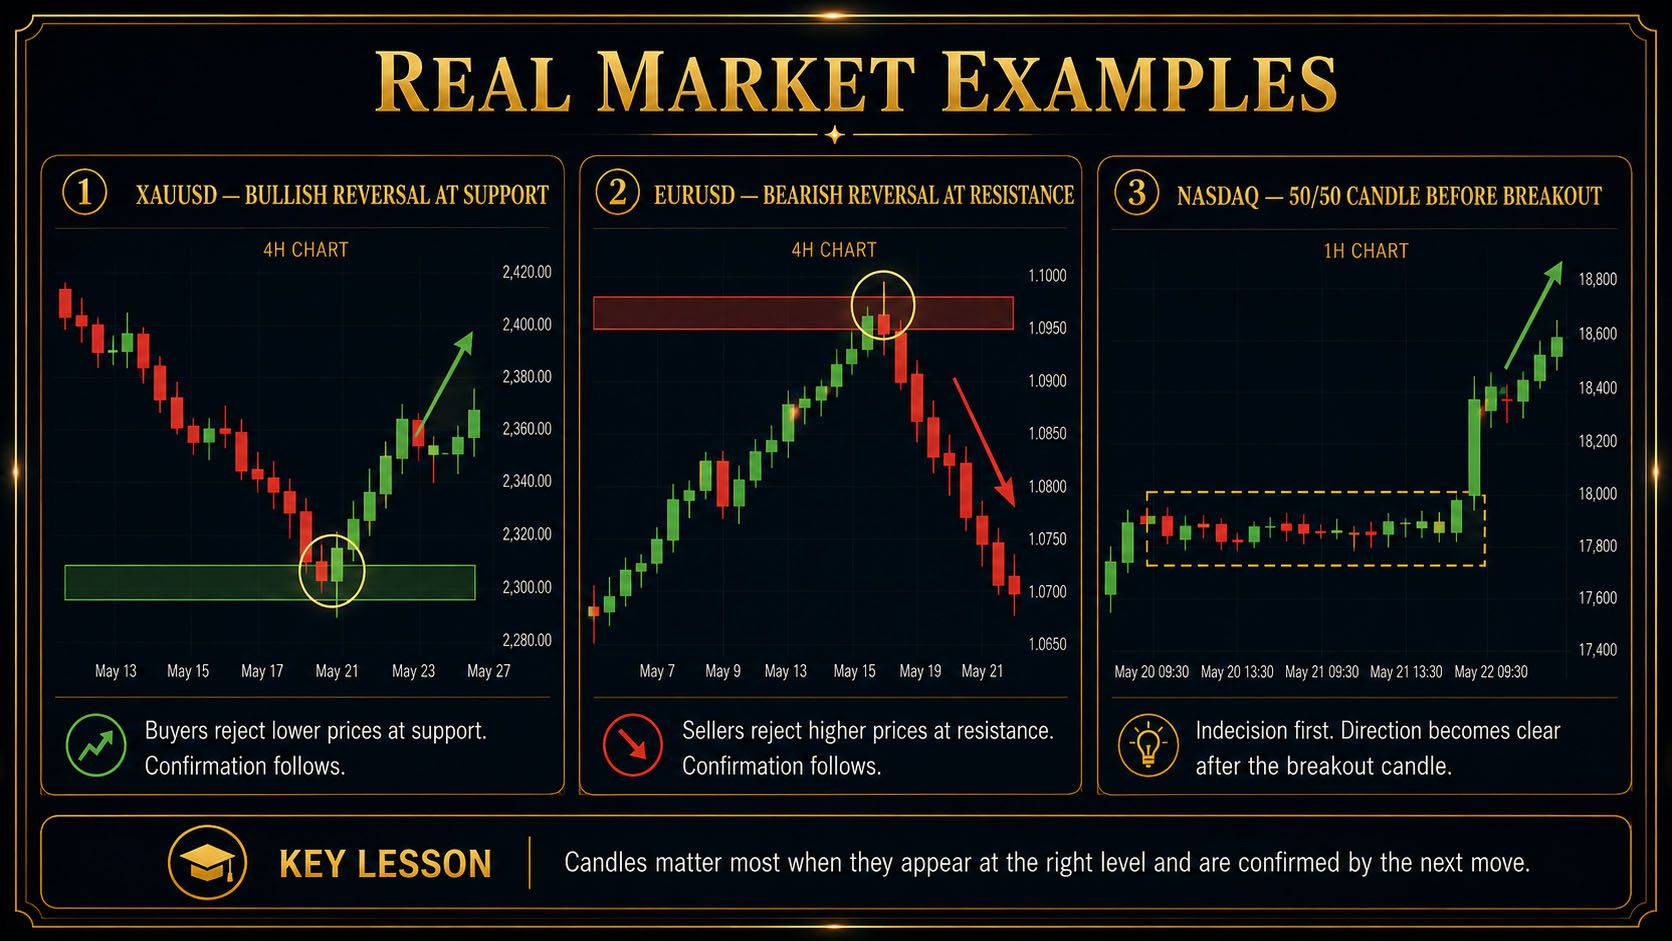
Gold pulls back into a clear support zone during London session. A long lower wick forms, showing sellers pushed price down but buyers rejected the move.
The trader does not buy immediately. They wait for the next candle to confirm bullish momentum before considering an entry.
EURUSD
EURUSD is trending lower and pulls back into resistance. A bearish reversal candle forms with a long upper wick. This shows buyers attempted to push higher but sellers stepped in.
If the next candle confirms bearish pressure, the setup becomes stronger.
NASDAQ
NASDAQ creates several small 50/50 candles near a key level before New York session volatility expands.
Instead of guessing direction during indecision, the professional trader waits for a strong continuation candle to show the breakout direction.
Professional Checklist
- Is the candle showing continuation, reversal, or indecision?
- Is the body bigger than the wick?
- Is the wick bigger than the body?
- Is the candle a 50/50 indecision candle?
- Did the candle form at a key level?
- Does the candle align with trend and structure?
- Did the next candle confirm the idea?
- Is risk clearly defined before entry?
- Does the setup fit your written trading plan?
This checklist should be part of your professional trading plan, especially if you are trading prop firm accounts with strict drawdown rules.
How Candlestick Patterns Protect Prop Firm Accounts
Prop firm traders need to avoid random entries. Candlestick patterns help when they are used correctly: as confirmation at a meaningful location, not as a reason to gamble on every candle shape.
Better Timing
Candles can help confirm when buyers or sellers are actually responding at a level.
Cleaner Risk
A clear rejection candle can help define invalidation and improve stop placement.
Less Emotion
Waiting for confirmation can reduce impulsive entries that pressure daily drawdown.
FAQ
Do candlestick patterns always work?
No. Candlestick patterns are not guarantees. They show clues about momentum, rejection, and indecision. You still need context, confirmation, and risk management.
What is the easiest way to understand candles?
Focus on body versus wick. If the body dominates, think continuation. If the wick dominates, think rejection. If both are small or balanced, think indecision.
Should I memorize every candlestick name?
No. It is better to understand what the candle is showing. Names are less important than reading momentum, rejection, and context.
Can I trade candles alone?
You should not. Candles should confirm structure, key levels, and market context. A candle pattern by itself is usually not enough.
What candle should beginners focus on first?
Start with the three major types: continuation candles, reversal candles, and 50/50 candles. This gives you a simple foundation without overcomplicating the chart.
Knowledge Quiz
- A continuation candle usually has what?
Answer: Body bigger than wick. - A reversal candle usually has what?
Answer: Wick bigger than body. - A 50/50 candle usually shows what?
Answer: Indecision. - A long lower wick at support may show what?
Answer: Buyers rejecting lower prices. - A long upper wick at resistance may show what?
Answer: Sellers rejecting higher prices. - Candlestick patterns are best used with what?
Answer: Context. - What does a doji by itself mean?
Answer: Wait for confirmation. - Body-dominant candles usually show what?
Answer: Momentum. - Wick-dominant candles usually show what?
Answer: Rejection. - The best traders use candles for what?
Answer: Confirmation.
Key Takeaways
- Candlesticks show the battle between buyers and sellers.
- Continuation candles usually have bodies bigger than wicks.
- Reversal candles usually have wicks bigger than bodies.
- 50/50 candles and dojis show indecision.
- Candles should confirm structure, levels, and market context.
- Do not trade candlestick patterns blindly.
- The next candle often matters more than the pattern itself.
Lesson Summary
Candlestick patterns help traders read momentum, rejection, and indecision. Continuation candles show strength when the body dominates. Reversal candles show rejection when the wick dominates. 50/50 candles and dojis show uncertainty. Professional traders do not trade candles blindly. They use candles to confirm market structure, support and resistance, trendlines, market context, and risk-to-reward before entering.