
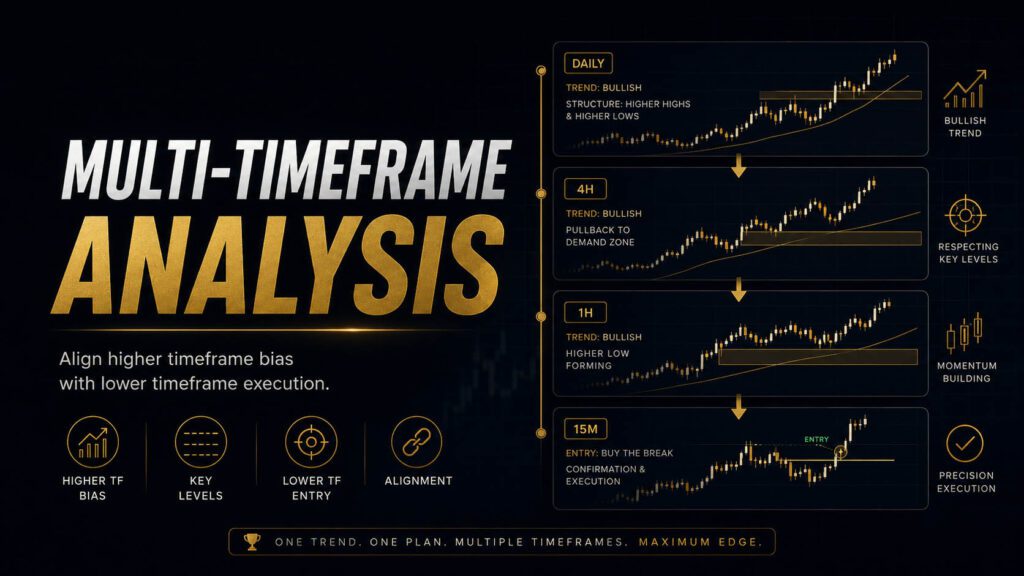
Multi-Timeframe Analysis
Learn how to align higher timeframe bias with lower timeframe execution so you can trade with clarity instead of confusion.
Learning Objectives
- Understand how different timeframes interact.
- Identify higher timeframe bias before looking for entries.
- Use lower timeframes for precise execution.
- Avoid conflicting signals across charts.
- Build a structured top-down analysis process.
- Improve trade accuracy and confidence.
- Combine structure, key levels, candlestick confirmation, and risk control.
- Use timeframe alignment to protect prop firm accounts from low-quality trades.
Why Multi-Timeframe Analysis Matters
Most traders fail because they look at one timeframe in isolation. The market does not move on just one timeframe. It moves across all of them.
A setup can look perfect on the 5-minute chart but still be fighting a major 4H resistance zone. A bearish candle on the 15-minute chart may mean very little if the daily chart is still strongly bullish. Multi-timeframe analysis helps you avoid this confusion.
Professional traders start from the bigger picture and work their way down. This connects directly to market structure, because higher timeframe structure gives you the cleanest view of who is in control.
The Timeframe Hierarchy
Each timeframe has a job. The problem begins when traders use the wrong timeframe for the wrong purpose. A lower timeframe should not decide your entire bias, and a higher timeframe should not be used for tiny entry timing.
| Timeframe | Purpose | Professional Use |
|---|---|---|
| Monthly / Weekly | Macro direction | Understand the bigger market environment and major zones. |
| Daily | Key structure and levels | Identify major trend direction, range conditions, and important reaction areas. |
| 4H | Trade bias and setup planning | Define whether you should mainly look for buys, sells, or no trade. |
| 1H / 15M | Entry timing | Look for confirmation, pullbacks, retests, and cleaner execution. |
| 5M / 1M | Fine-tuned execution | Used carefully for entries only after higher timeframe bias is already clear. |
This approach fits inside the broader technical analysis framework. First you identify context, then structure, then location, then confirmation, then risk.
Top-Down Analysis
Top-down analysis means starting from the higher timeframe and moving down step by step. Instead of reacting to the latest candle, you build a complete picture before risking money.
Step 1: Identify Higher Timeframe Bias
Start with the daily or 4H chart. Determine if the market is trending up, trending down, ranging, or transitioning. Do not rush into entries until the bigger picture is clear.
Step 2: Mark Key Levels
Identify major support, resistance, supply, demand, and reaction zones. These are the areas where price is more likely to pause, reject, break, or retest.
Step 3: Drop to the Lower Timeframe
Use the 1H, 15M, or 5M chart to find precise entries with confirmation. Lower timeframes are for execution, not for inventing a bias that disagrees with the bigger chart.
Step 4: Confirm Risk Before Entry
Before entering, make sure the stop loss, target, and trade location make sense. A trade can be directionally correct and still be bad if the risk-to-reward is poor.
Key levels should come from support and resistance, while entry confirmation can come from candlestick patterns or a clean lower-timeframe structure shift.
Alignment vs Conflict
Multi-timeframe analysis is powerful because it helps you separate aligned trades from conflicting trades. Aligned trades are not guaranteed, but they usually make more sense because the bigger picture supports the entry idea.
Aligned Setup
- Higher timeframe is bullish.
- Price pulls back into a higher timeframe support zone.
- Lower timeframe shows bullish confirmation.
- Entry is in the direction of the larger trend.
- Risk is clearly defined below structure.
Conflicting Setup
- Higher timeframe is bullish.
- Lower timeframe flashes a small bearish signal.
- The sell idea fights the bigger trend.
- Reward-to-risk is weak because support is nearby.
- The trader is reacting to noise instead of context.
When timeframes conflict, patience matters. Review Patience Pays and avoid forcing trades when the chart is not aligned.
How Many Timeframes Should You Use?
More timeframes do not automatically mean better analysis. Too many charts can create confusion, hesitation, and mixed signals. Most traders only need two or three timeframes.
| Trading Style | Bias Timeframe | Setup Timeframe | Entry Timeframe |
|---|---|---|---|
| Swing Trading | Weekly / Daily | Daily / 4H | 4H / 1H |
| Day Trading | Daily / 4H | 4H / 1H | 15M / 5M |
| Scalping | 4H / 1H | 1H / 15M | 5M / 1M |
This is especially important inside prop firm challenges, where overanalyzing can lead to hesitation, missed entries, and emotional recovery trades.
Practical Examples
EURUSD Bullish Alignment
The daily chart shows EURUSD in an uptrend. The 4H chart pulls back into a clean support zone. The 15M chart then shows bullish rejection and a small structure shift.
A beginner may sell the pullback because the 15M chart looks bearish for a moment. A professional understands that the lower timeframe pullback may simply be an opportunity to join the higher timeframe trend.
XAUUSD Bearish Bias
The 4H chart on gold is bearish and price is forming lower highs. The 1H chart shows a small rally into resistance. Instead of buying the rally, the trader waits for bearish confirmation near the higher timeframe zone.
This prevents the trader from fighting the larger flow and improves trade location.
NASDAQ Range Conditions
The daily chart shows NASDAQ stuck inside a range. Lower timeframes are noisy and choppy. Instead of forcing a breakout trade, the professional trader waits for price to reach the range edges or break with confirmation.
This protects the account from low-quality trades inside messy conditions.
US30 Conflicting Signal
The 4H chart is bullish, but the 5M chart prints a bearish candle. A trader who focuses only on the 5M chart may short too early. A professional waits to see whether the lower timeframe weakness actually changes the bigger structure.
Multi-Timeframe Analysis and Risk Management
Multi-timeframe analysis does not remove risk, but it can help you place risk more intelligently. When higher timeframe structure and lower timeframe confirmation align, the trade usually has clearer invalidation.
Better Stop Placement
Higher timeframe levels help identify where the trade idea is actually wrong, while lower timeframes can help refine the entry.
Better Reward-to-Risk
Lower timeframe entries can improve the entry point, but only when they still align with the higher timeframe setup.
Always compare your setup with risk-to-reward and daily drawdown before entering.
Common Mistakes
- Trading only one timeframe.
- Ignoring higher timeframe structure.
- Entering too early without confirmation.
- Overcomplicating with too many charts.
- Forcing trades when timeframes do not align.
- Using lower timeframes to justify emotional entries.
- Changing bias every time a small candle forms.
Many timeframe mistakes come from impatience or overtrading. Your goal is not to find a reason to enter. Your goal is to wait until the timeframes agree enough to risk capital professionally.
Professional Checklist
- Check higher timeframe bias first.
- Mark key support, resistance, and reaction zones.
- Identify whether the market is trending, ranging, or transitioning.
- Drop to the lower timeframe only after bias is clear.
- Wait for lower timeframe confirmation.
- Trade with alignment whenever possible.
- Confirm stop loss, target, and reward-to-risk.
- Skip the trade when timeframes are messy or conflicting.
This checklist should be built into your professional trading plan so you are not making timeframe decisions emotionally during live market conditions.
FAQ
What timeframe is best?
There is no single best timeframe. The best approach is proper alignment. Use higher timeframes for bias and lower timeframes for execution.
Should I use many timeframes?
No. Keep it simple. Most traders only need two or three timeframes. Too many timeframes can create confusion and conflicting opinions.
Can I trade only the lower timeframe?
You can, but it usually lowers probability because you may be trading against stronger higher timeframe pressure.
Why do trades fail even when the lower timeframe looks good?
Often because the lower timeframe setup is fighting higher timeframe structure, nearby support or resistance, or poor market context.
How do I improve consistency with multi-timeframe analysis?
Focus on alignment, discipline, and repeatable rules. Do not change your bias every time a small candle forms on a lower timeframe.
Knowledge Quiz
- What does the higher timeframe usually show?
Answer: Bias. - What is the lower timeframe mainly used for?
Answer: Entry timing. - When do the best trades usually happen?
Answer: When timeframes are aligned. - What does conflict between timeframes usually mean?
Answer: A weaker trade setup. - Where does top-down analysis start?
Answer: Higher timeframe. - How many timeframes do most traders need?
Answer: Two or three. - What should you mark after identifying higher timeframe bias?
Answer: Key levels and reaction zones. - Why can lower timeframes be dangerous?
Answer: They can create noise and emotional entries. - What should happen before using a lower timeframe entry?
Answer: The higher timeframe bias should be clear. - What should you do when timeframes are messy or conflicting?
Answer: Stay patient and skip low-quality trades.
Key Takeaways
- Higher timeframe controls direction and bias.
- Lower timeframe refines entries and timing.
- Alignment increases probability.
- Conflict reduces edge and creates confusion.
- Simple structure beats overcomplicated chart flipping.
- Most traders only need two or three timeframes.
- Top-down analysis improves clarity, trade selection, and risk planning.
- Prop firm traders should skip trades when timeframes do not align clearly.
Lesson Summary
Multi-timeframe analysis helps traders align the bigger market picture with lower timeframe execution. Higher timeframes show bias, structure, and major levels. Lower timeframes help refine entries and confirmation. The goal is not to overcomplicate the chart. The goal is to avoid fighting the bigger move, improve trade location, and make cleaner decisions inside prop firm rules.