

Trendlines & Channels
Learn how to map dynamic structure, spot orderly trends, and use trendlines and channels to frame high-quality trade ideas with cleaner risk.
Learning Objectives
- Understand what trendlines and channels actually represent.
- Draw proper bullish and bearish trendlines without forcing them.
- Identify when a channel is clean, usable, and worth respecting.
- Use dynamic support and resistance alongside horizontal levels.
- Recognize the difference between a healthy retest and a broken trend.
- Avoid common beginner mistakes like overfitting lines to price.
- Use channels to improve entries, stop placement, and trade timing.
- Connect trendlines with market structure, confirmation, and risk management.
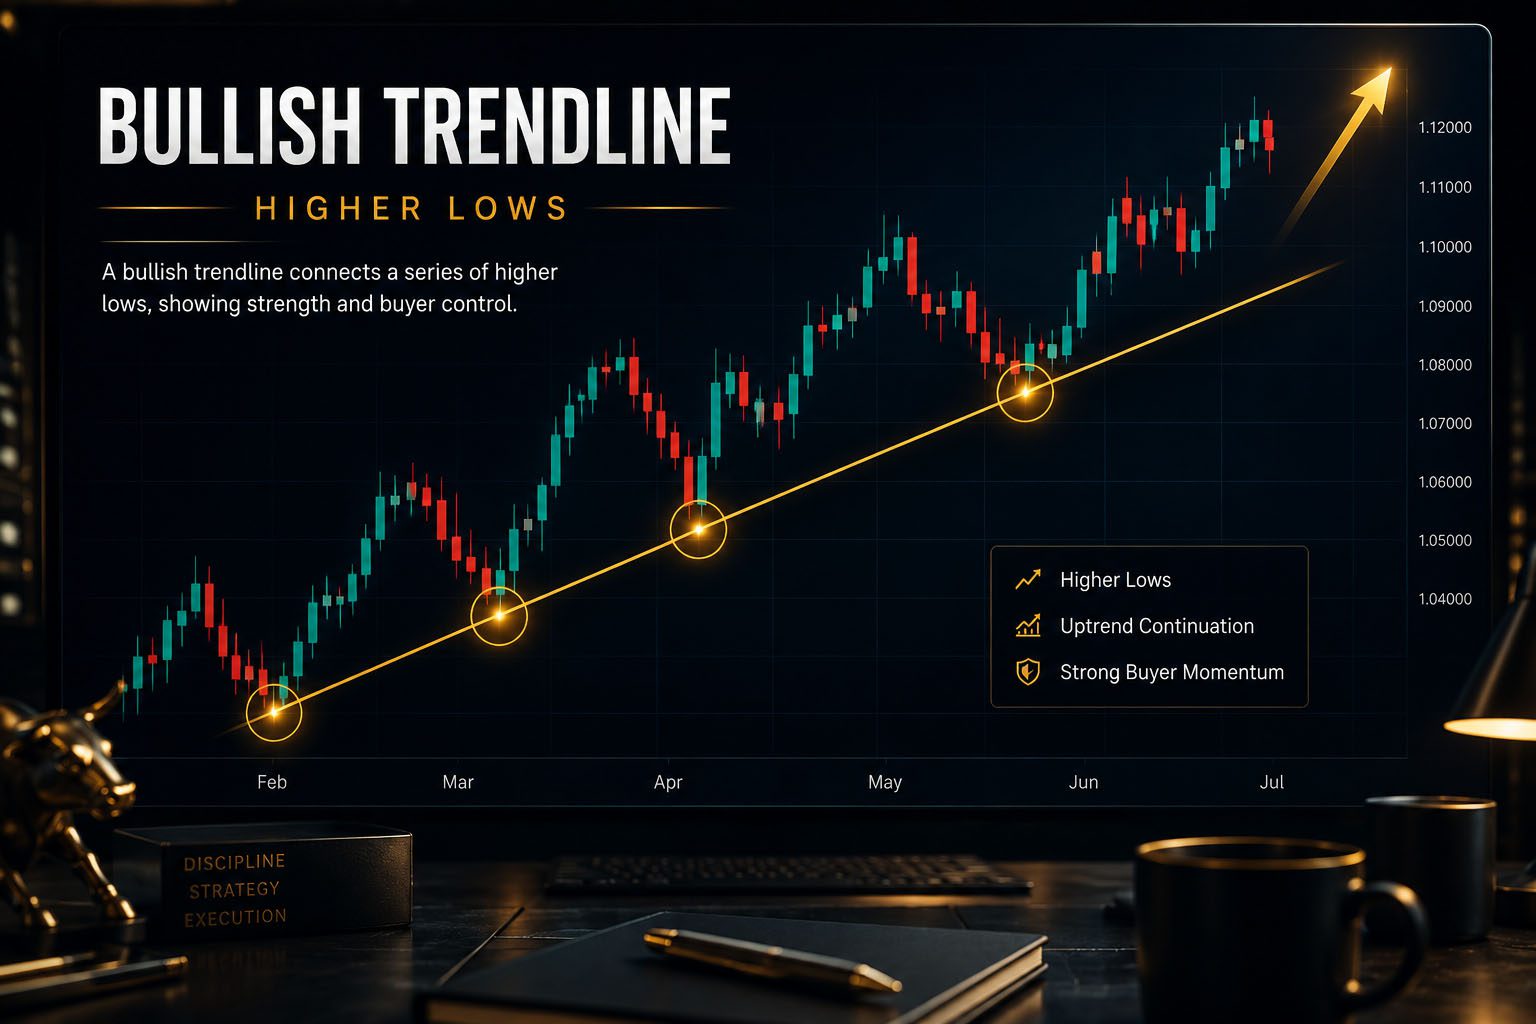
What Are Trendlines?
A trendline is a diagonal line drawn across swing points to show the direction and rhythm of price. Unlike horizontal support and resistance, trendlines are dynamic. They change with the movement of the market.
Bullish Trendline
In an uptrend, a bullish trendline is usually drawn beneath higher lows. It helps visualize where buyers keep stepping in as price trends upward.
Bearish Trendline
In a downtrend, a bearish trendline is usually drawn across lower highs. It shows where sellers continue defending rallies and pushing price lower.
Trendlines work best when they support what you already see in market structure. A bullish trendline beneath higher lows is more meaningful than a random diagonal line drawn to justify an entry.

How to Draw a Proper Trendline
The biggest mistake beginners make is forcing a line to fit the market. A proper trendline should reflect the actual flow of price, not your opinion.
Rules for Cleaner Trendlines
- Use obvious swing points, not random candle wicks.
- Connect at least two meaningful touches. Three is stronger.
- Do not cut awkwardly through major candle bodies just to make it fit.
- Prioritize clean structure over perfect precision.
- Use higher timeframes first, then refine on lower timeframes if needed.
This is why trendlines should be used with multi-timeframe analysis. A trendline on the 5-minute chart means much less if the 1H or 4H structure is pointing against it.

What Are Channels?
A channel forms when price moves between two parallel trendlines. One side acts like dynamic support and the other acts like dynamic resistance. Channels help traders understand whether price is moving in an orderly trend or starting to lose structure.
Ascending Channel
An ascending channel forms when price creates higher highs and higher lows within two rising boundaries. Traders often watch the lower boundary for bullish reactions and the upper boundary for profit-taking or rejection.
Descending Channel
A descending channel forms when price creates lower highs and lower lows within two falling boundaries. Traders often watch the upper boundary for short opportunities and the lower boundary for potential exits.
Sideways Channel
Sometimes price drifts in a range-like channel with little trend conviction. In these conditions, traders must be more patient and selective.
| Structure | What It Suggests | Trader Focus |
|---|---|---|
| Bullish Trendline | Buyers are defending higher lows. | Watch pullbacks for support. |
| Bearish Trendline | Sellers are defending lower highs. | Watch rallies for rejection. |
| Ascending Channel | Orderly bullish trend. | Lower edge entry, upper edge management. |
| Descending Channel | Orderly bearish trend. | Upper edge short bias, lower edge exit planning. |
Channels become even more useful when they match the broader market context. A clean channel in a trending market is more useful than a forced channel inside random chop.
Dynamic Support & Resistance
Trendlines and channels create dynamic support and resistance. This means the level changes with time instead of staying flat like a horizontal zone.
Why This Matters
Markets often respect diagonal structure during strong trends. If you only mark horizontal levels, you may miss where price is actually being defended in real time.
Best Use Case
Dynamic structure works best when combined with horizontal structure, market context, and confirmation. A trendline by itself is useful. A trendline that lines up with a support zone and bullish price action is much stronger.
That is why this lesson should be combined with support and resistance. Horizontal zones give you location, while trendlines and channels show the rhythm of price.
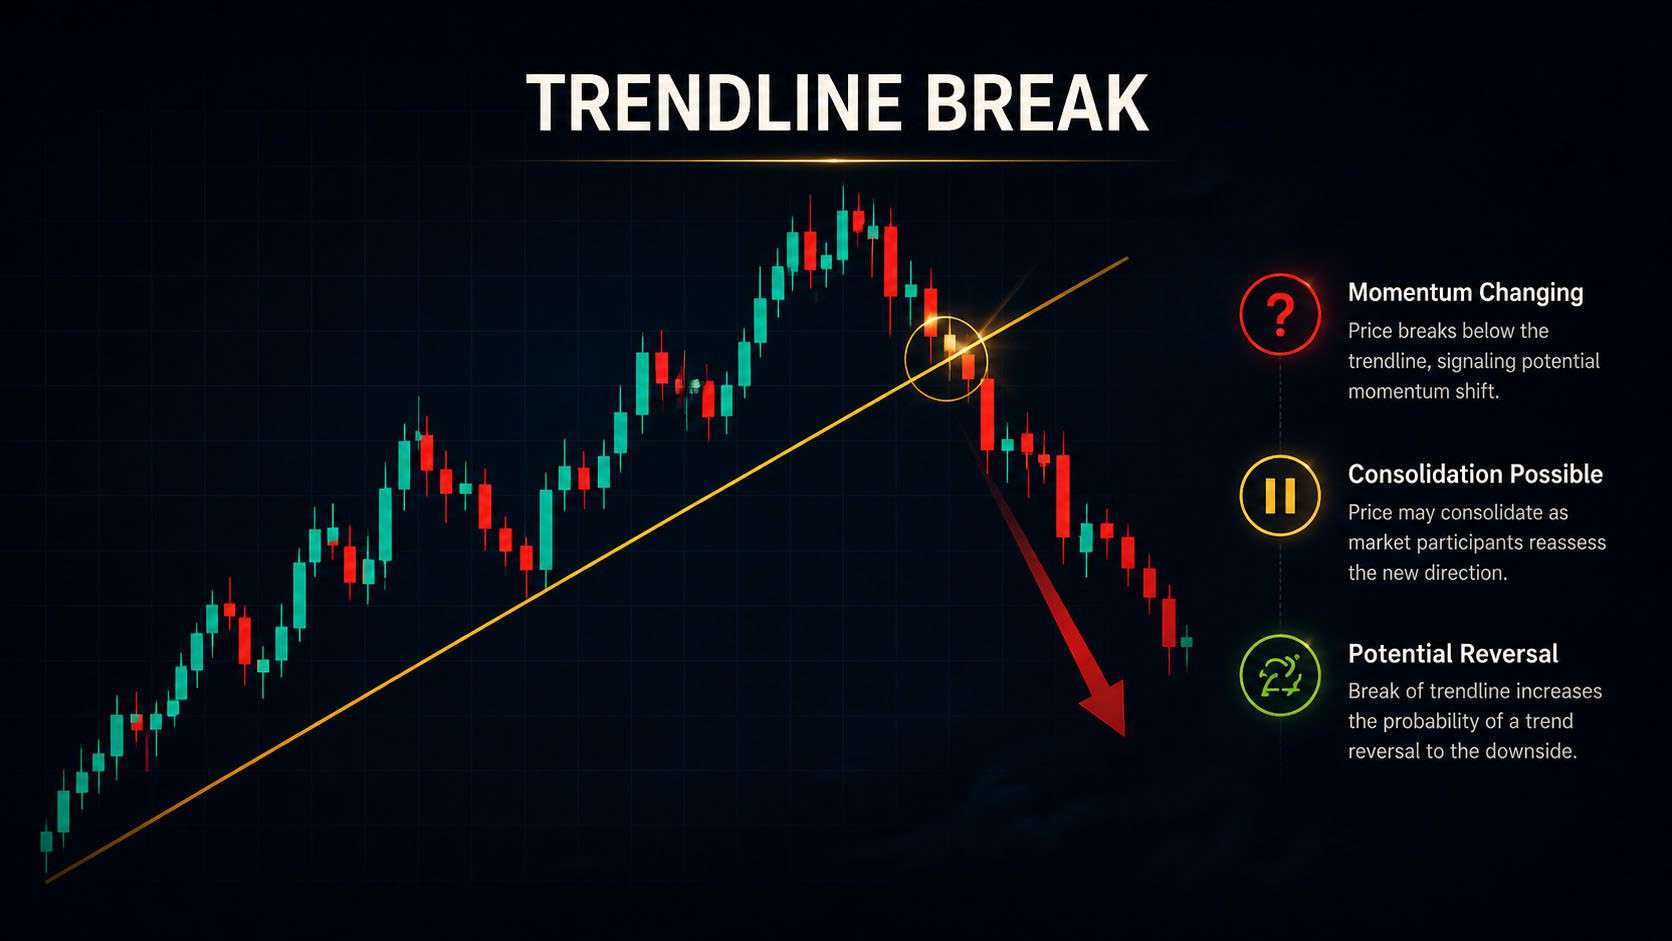
When a Trendline Breaks
A broken trendline does not always mean a full reversal, but it does mean the current pace of the trend has changed. That matters.
Possible Outcomes After a Break
- Price pauses and consolidates before continuing.
- The trend weakens and transitions into a channel or range.
- A real reversal begins.
Professional traders do not assume every break is a trade. They wait to see what price does next. Did structure shift? Did momentum change? Did the broken line retest and fail?
Before trading a break, compare it with risk-to-reward and nearby support or resistance. A dramatic break is still a bad trade if the stop is wide and the target is too close.
Practical Trading Examples
XAUUSD Example
Gold trends higher during London session inside a rising channel. Price pulls back into the lower channel boundary, which also lines up with a prior support zone.
Instead of buying randomly in the middle of the move, the trader waits for price to test the lower edge and form bullish confirmation.
EURUSD Example
EURUSD respects a clean bearish trendline for several sessions. Each rally into the line fails and produces lower highs.
A professional trader watches for short entries only when price returns into that dynamic resistance area rather than chasing breakdowns after extended candles.
NASDAQ Example
NASDAQ trades inside an ascending channel during New York session. The upper boundary keeps attracting profit-taking.
A disciplined trader understands that buying directly into the top of the channel offers weak reward relative to risk.
US30 Example
US30 breaks below a bullish trendline, but instead of collapsing, it moves sideways for hours. This tells the trader the break changed momentum, but did not yet confirm a strong bearish move.
Patience avoids a forced entry and protects the account from unnecessary drawdown.
Common Beginner Mistakes
- Drawing trendlines through random candles.
- Using every minor touch as if it matters.
- Forcing perfectly parallel channels where none exist.
- Trading the first touch without confirmation.
- Ignoring horizontal support and resistance.
- Assuming every trendline break means reversal.
- Taking trades in the middle of the channel instead of near the edges.
Many of these mistakes come from impatience. Review Patience Pays and Overtrading if you find yourself forcing trendline trades that are not truly clean.
Professional Checklist
- Start with higher timeframe structure first.
- Use only obvious swing highs and lows.
- Look for at least two quality touches before trusting a line.
- Do not force channels that are not clean.
- Use trendlines together with horizontal zones.
- Wait for confirmation near dynamic support or resistance.
- Avoid entering in the middle of the channel.
- Plan stop loss around structure, not emotion.
This checklist belongs inside your professional trading plan. Clean chart structure only matters when it leads to consistent execution.
How Trendlines Protect Prop Firm Accounts
Prop firm traders need clear structure before risking capital. Trendlines and channels help identify where price may react, where a trend may weaken, and where entries may offer cleaner reward-to-risk.
Better Trade Location
Channel edges often provide cleaner locations than random entries in the middle of a move. Better location usually creates cleaner stop placement.
Drawdown Protection
Waiting for structure and confirmation helps avoid emotional entries that can pressure daily drawdown.
FAQ
How many touches does a trendline need?
At least two touches can define a trendline, but three clean touches usually make it more meaningful.
Should I use candle wicks or bodies?
Usually the cleanest line comes from respecting obvious swing points. Sometimes that includes wicks, sometimes it aligns better with bodies. The goal is clean structure, not perfection.
Are channels always parallel?
Most clean channels are close to parallel, but the market is not always perfectly symmetrical. If the structure is messy, it may not be worth trading as a channel.
Is a broken trendline enough to enter a reversal trade?
No. A trendline break only tells you momentum may be changing. You still need confirmation, context, and risk control.
What is the best place to enter in a channel?
Generally near the channel edges, not the middle. The middle often offers poor reward-to-risk and weaker structure.
Knowledge Quiz
- A bullish trendline is usually drawn beneath what?
Answer: Higher lows. - A bearish trendline is usually drawn across what?
Answer: Lower highs. - What is a channel?
Answer: Two parallel boundaries guiding price. - What is dynamic support and resistance?
Answer: Diagonal levels that change with price flow. - Where do the best trades inside a channel often come from?
Answer: The channel edges. - Does a broken trendline guarantee reversal?
Answer: No. It shows a change in pace, not certainty. - A good trendline should be drawn from what?
Answer: Obvious swing points. - If a channel is messy and unclear, what should a professional trader do?
Answer: Stay selective. - Combining a trendline with a horizontal level usually makes a setup what?
Answer: Stronger. - Trendlines are most useful for understanding what?
Answer: Market rhythm and structure.
Key Takeaways
- Trendlines help visualize the rhythm of a trend.
- Channels show how price moves between dynamic support and resistance.
- The best lines come from obvious swing points, not forced angles.
- Dynamic structure works best when paired with horizontal structure.
- A trendline break changes momentum, but does not guarantee reversal.
- Channel edges often provide better trade locations than the middle.
- Clean structure leads to cleaner risk management.
Lesson Summary
Trendlines and channels help traders understand the rhythm of price, identify dynamic support and resistance, and plan better trade locations. A bullish trendline shows buyers defending higher lows, while a bearish trendline shows sellers defending lower highs. Channels frame orderly trends and help traders avoid poor entries in the middle of a move. The best use of trendlines comes when they align with horizontal levels, market structure, multi-timeframe context, confirmation, and disciplined risk management.