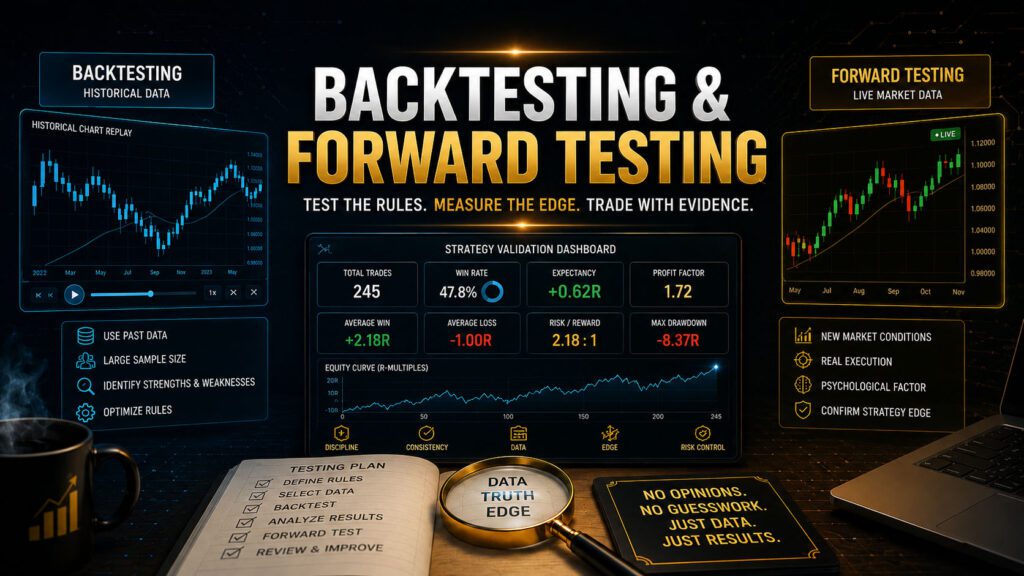
Backtesting & Forward Testing
Learn how to test a trading strategy with historical data and live market conditions so you can measure its edge before risking meaningful capital.Lesson Introduction
A Strategy Is Only an Idea Until It Has Been Tested
A trading strategy can sound intelligent, look impressive on a chart, and still fail when applied consistently. The only reliable way to learn whether a strategy has potential is to test the exact rules across a meaningful sample of trades. Backtesting applies your strategy to historical market data. Forward testing applies the same rules to new market conditions as they unfold. Together, these processes help you evaluate whether the strategy is profitable, stable, realistic, and suitable for your personality and risk tolerance. Testing is not about proving that your strategy works. It is about discovering the truth. Sometimes the data confirms an edge. Sometimes it exposes weaknesses. Both outcomes are valuable because they prevent blind confidence. This lesson continues directly from Building Your First Trading Strategy. Before testing, your entry, stop loss, target, risk, timing, and no-trade rules must already be written clearly.Professional principle: Test the strategy you actually wrote—not the strategy you wish you had written after seeing what happened next.
Learning Objectives
- Understand the difference between backtesting and forward testing.
- Prepare objective strategy rules before testing begins.
- Choose an appropriate historical sample.
- Record every valid setup consistently.
- Calculate win rate, average reward, expectancy, and drawdown.
- Identify execution mistakes separately from strategy losses.
- Avoid hindsight bias and overfitting.
- Evaluate performance across different market conditions.
- Forward test under realistic trading conditions.
- Decide when a strategy is ready for live capital.
1. What Is Backtesting?
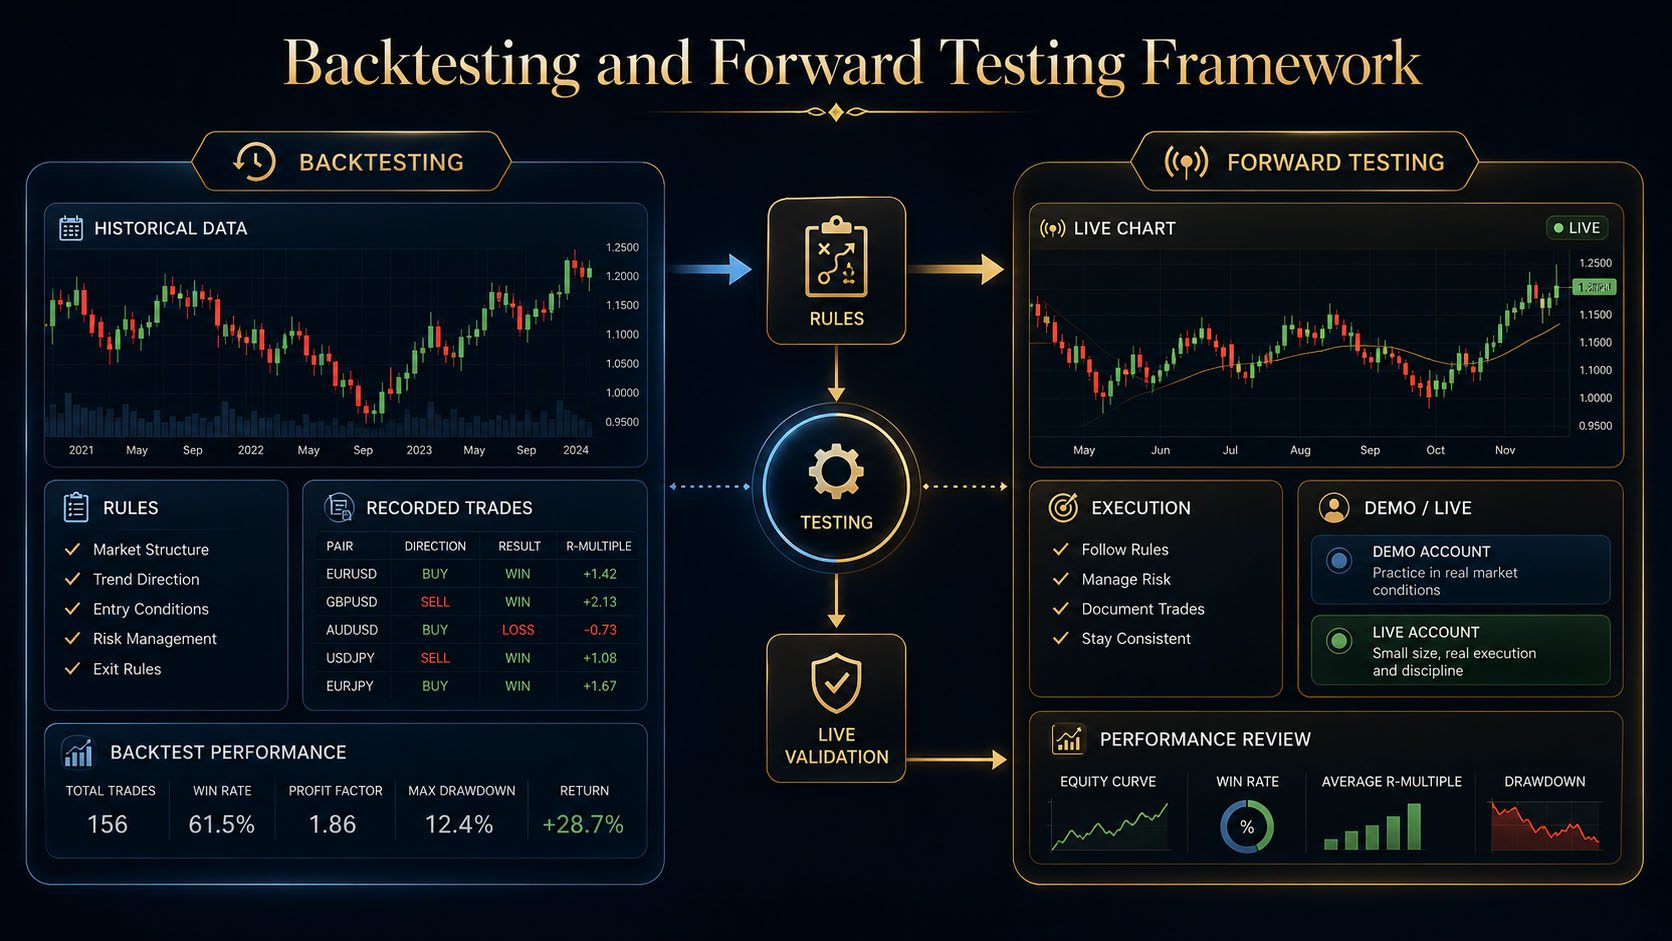
Backtesting is the process of applying a fixed set of strategy rules to historical market data. You move through past price action as though the future were unknown and record every trade that would have qualified.
The purpose is to estimate how the strategy may have performed under previous market conditions. Backtesting can reveal the strategy’s frequency, average win, average loss, win rate, drawdown, risk-to-reward profile, and sensitivity to different sessions or market environments.
What Backtesting Can Help You Learn
- How often valid setups appear.
- Which instruments suit the strategy.
- Which sessions produce the strongest results.
- How many consecutive losses may occur.
- Whether the target is realistic.
- Whether the stop is too tight or too wide.
- Whether confirmation improves results.
- How the strategy behaves in trends, ranges, and volatile conditions.
Backtesting does not guarantee future profits. It provides evidence about how the strategy behaved under past conditions.
2. What Is Forward Testing?
Forward testing means applying the strategy to new market data after the rules have been written and backtested. The strategy is tested in real time or simulated real-time conditions without using future candles.
This stage shows whether the historical results can survive live spreads, changing volatility, psychological pressure, missed entries, slippage, news, and real execution.
Forward Testing Can Be Performed Through
- A demo account.
- A trading simulator.
- Replay mode with hidden future candles.
- A very small live account.
- A paper trading journal.
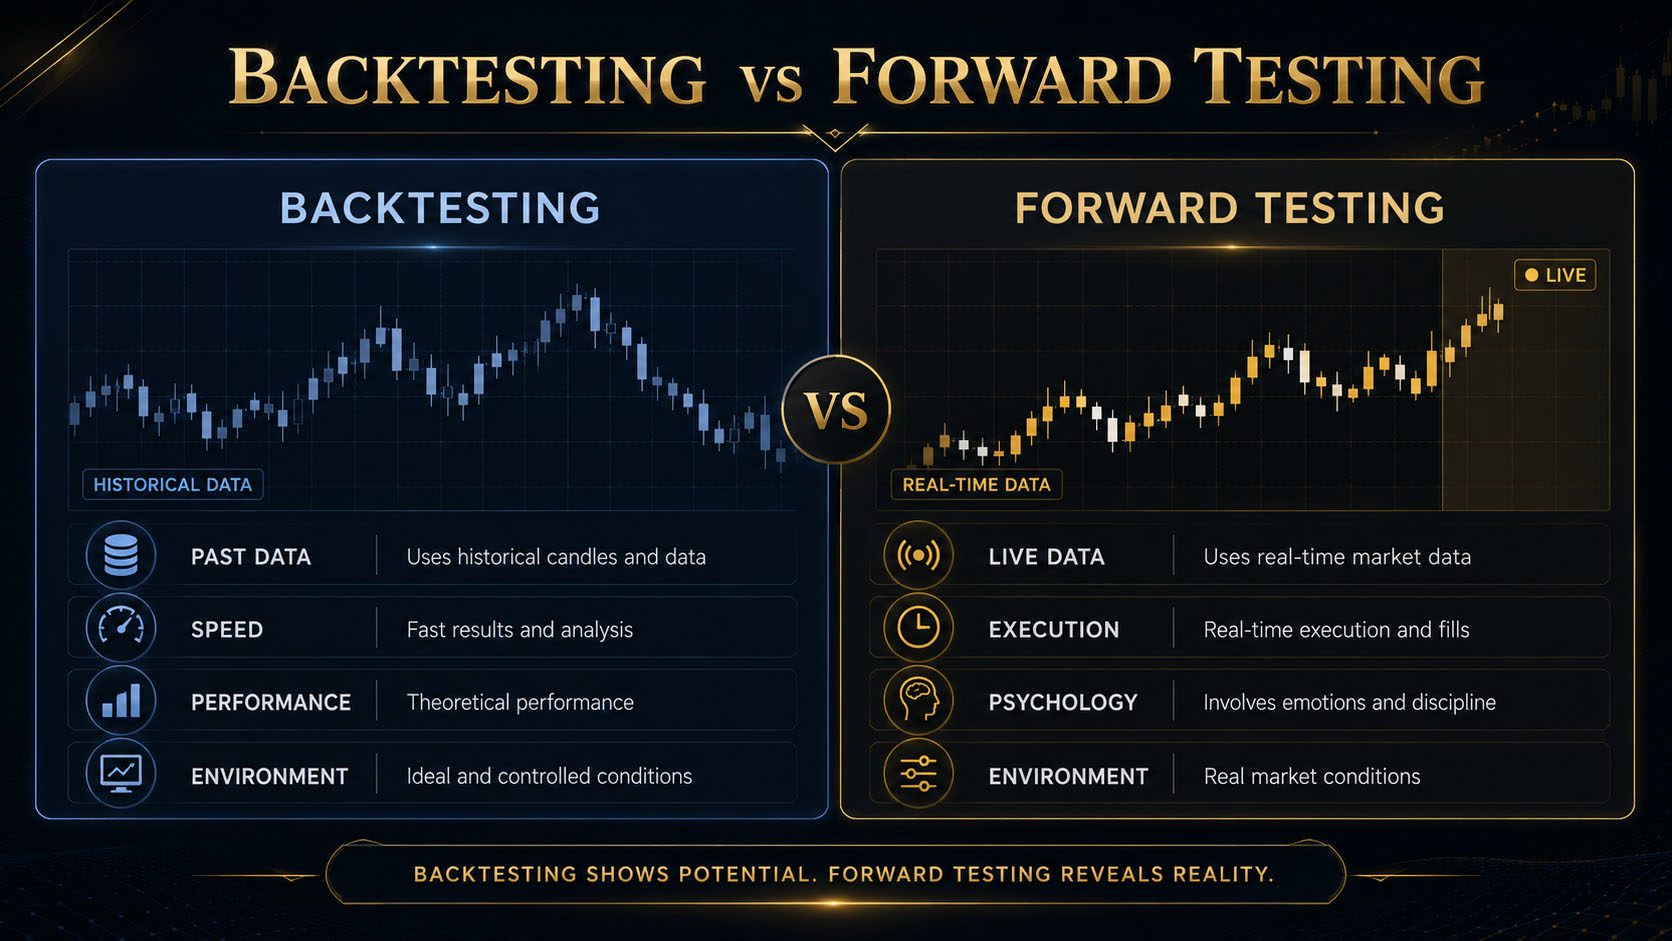
Backtesting measures the rules. Forward testing measures the rules plus the trader.
3. Backtesting vs Forward Testing
Backtesting
Historical Validation
- Uses past market data.
- Can produce a large sample faster.
- Helps refine clear strategy rules.
- Measures theoretical execution.
- Can be affected by hindsight bias.
- Does not fully reproduce emotional pressure.
Forward Testing
Real-Time Validation
- Uses new market data.
- Requires more time.
- Tests realistic entries and execution.
- Includes spread, timing, and missed opportunities.
- Reveals psychological weaknesses.
- Shows whether the rules are practical.
4. Testing Starts With Fixed Rules
You cannot test a strategy that changes from trade to trade. Before beginning, write every important condition in objective language.
Your Test Plan Must Define
- The instruments being tested.
- The historical period.
- The trading session and time window.
- The higher-timeframe market context.
- The exact setup location.
- The entry confirmation.
- The order type.
- The stop loss rule.
- The target and management method.
- The risk per trade.
- The no-trade conditions.
If you change a rule halfway through the test, the results belong to two different strategies and should not be combined.
Review Building Your First Trading Strategy, Entry Confirmation, and Stop Loss Placement.
5. Manual Backtesting vs Automated Backtesting
Manual Backtesting
The trader reviews charts and records qualifying trades manually. This is slower, but it helps develop chart-reading skill and is useful for strategies involving context, structure, and discretion.Advantages
- Builds market recognition.
- Allows visual context analysis.
- Works for price-action strategies.
- Helps identify unclear rules.
Disadvantages
- Time-consuming.
- Vulnerable to hindsight bias.
- Harder to test thousands of trades.
- Results depend on consistent interpretation.
Automated Backtesting
Software or code applies programmed rules to historical data. It is powerful for objective systems that can be expressed mathematically.Advantages
- Processes large datasets quickly.
- Applies rules consistently.
- Allows rapid parameter comparison.
- Produces detailed statistics.
Disadvantages
- Requires accurate coding.
- May oversimplify discretionary context.
- Can hide data-quality problems.
- Encourages excessive optimization.
Manual testing is usually the best place for a beginner to start because it forces you to understand every strategy decision.
6. Choose a Meaningful Historical Sample
A test must include enough trades and enough market variety to produce useful evidence. Testing only the cleanest month on a chart can create false confidence.
Your Historical Sample Should Include
- Trending conditions.
- Range-bound conditions.
- High-volatility periods.
- Low-volatility periods.
- Different months and seasons.
- Major economic events.
- Winning and losing streaks.
- More than one instrument if the strategy permits it.
Sample Size Guidance
20Too small for strong conclusions
50Early directional evidence
100Useful beginner sample
200+Stronger statistical confidence
A larger sample does not repair inconsistent rules. Quality of execution matters as much as quantity of trades.
7. How to Perform a Manual Backtest
1
Select DataChoose the market, timeframe, and date range.
2
Hide the FutureUse replay mode or advance candle by candle.
3
Apply RulesTake every valid setup exactly as written.
4
Record ResultsTrack entry, stop, target, outcome, and notes.
5
Review DataCalculate performance and identify patterns.
Advance the chart one candle at a time. If you can see the full move before deciding, you are not backtesting—you are explaining history.
8. What to Record for Every Trade
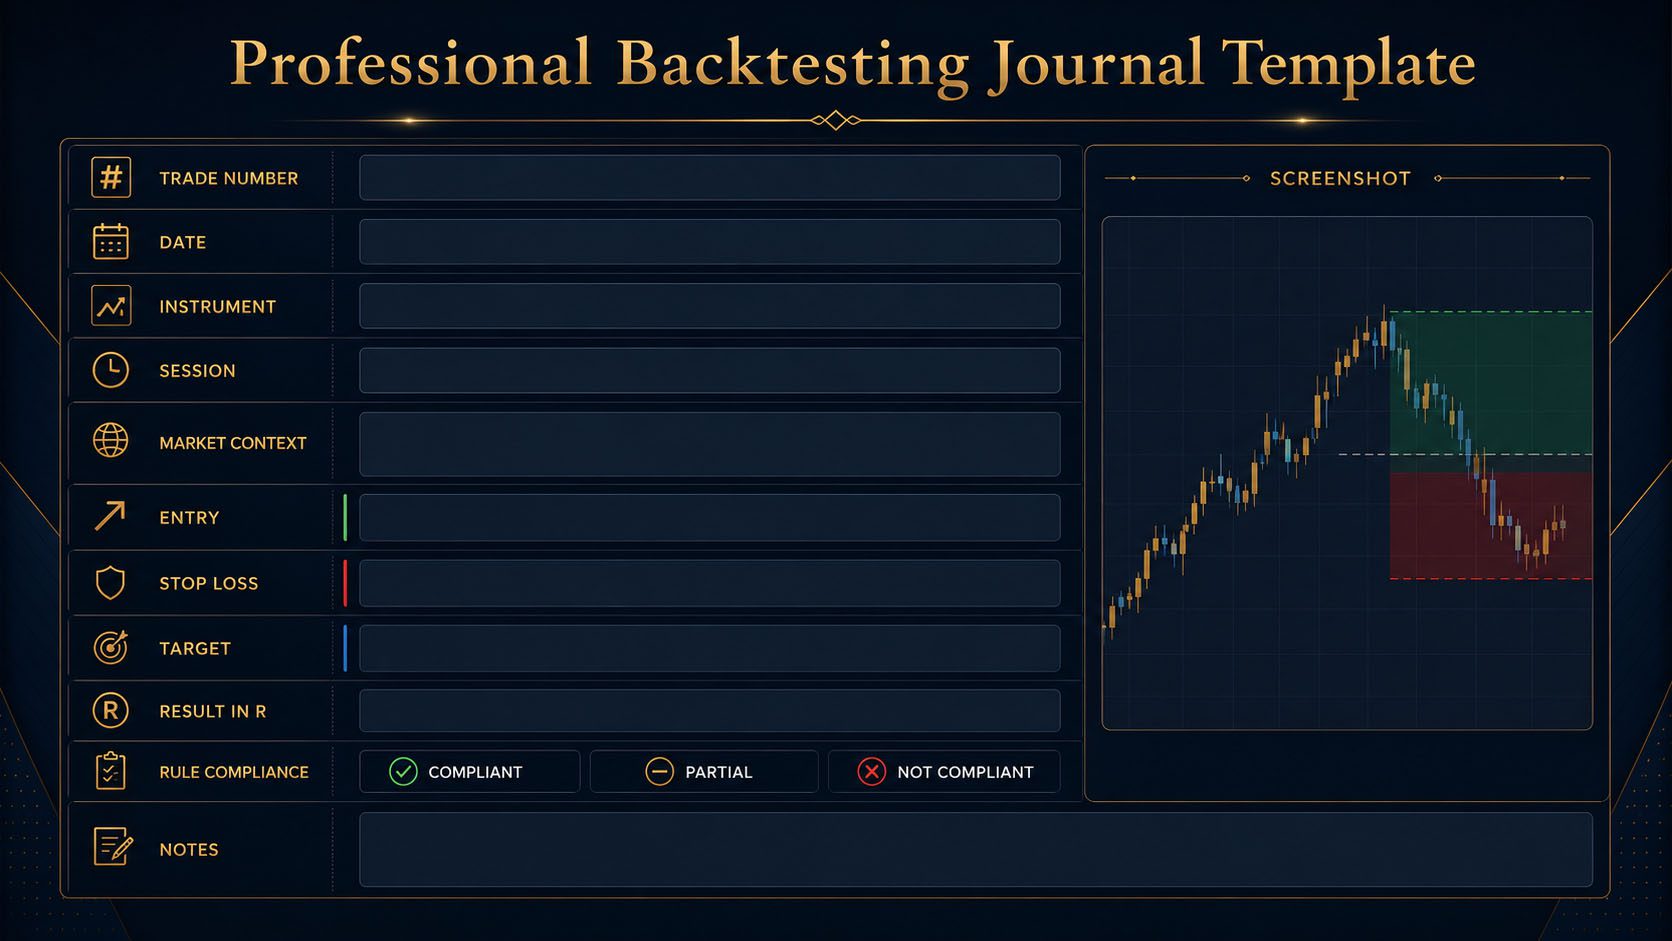
Backtesting Journal Fields
Trade Number
Assign a unique number to each setup.
Date and Time
Record when the setup occurred.
Instrument
Record the currency pair or market.
Trading Session
Asian, London, New York, overlap, or another defined window.
Market Context
Trend, range, volatility, support, resistance, and higher-timeframe bias.
Entry Reason
The exact setup and confirmation used.
Entry Price
The theoretical or executed entry.
Stop Loss
The invalidation level and stop distance.
Profit Target
The target level and planned risk-to-reward.
Outcome
Win, loss, break-even, partial result, or missed trade.
Result in R
Record profit or loss as a multiple of the original risk.
Rule Compliance
Did the trade satisfy every strategy rule?
Screenshot
Save the chart before entry and after completion.
Notes
Record news, spread, volatility, errors, and observations.
9. Measure Results in R-Multiples
An R-multiple expresses the result of a trade relative to the amount originally risked. One R equals the planned loss if the stop is hit.
Trade Result in R = Profit or Loss ÷ Original Risk
If you risk $100 and lose $100, the result is -1R. If you risk $100 and earn $250, the result is +2.5R.
| Cash Risk | Cash Result | R-Multiple | Meaning |
|---|---|---|---|
| $100 | -$100 | -1R | Full planned loss. |
| $100 | $0 | 0R | Break-even trade. |
| $100 | +$100 | +1R | Profit equals original risk. |
| $100 | +$200 | +2R | Profit is twice the original risk. |
| $100 | +$350 | +3.5R | Profit is 3.5 times the risk. |
R-multiples allow you to compare trades and strategies without being distracted by account size or lot size.
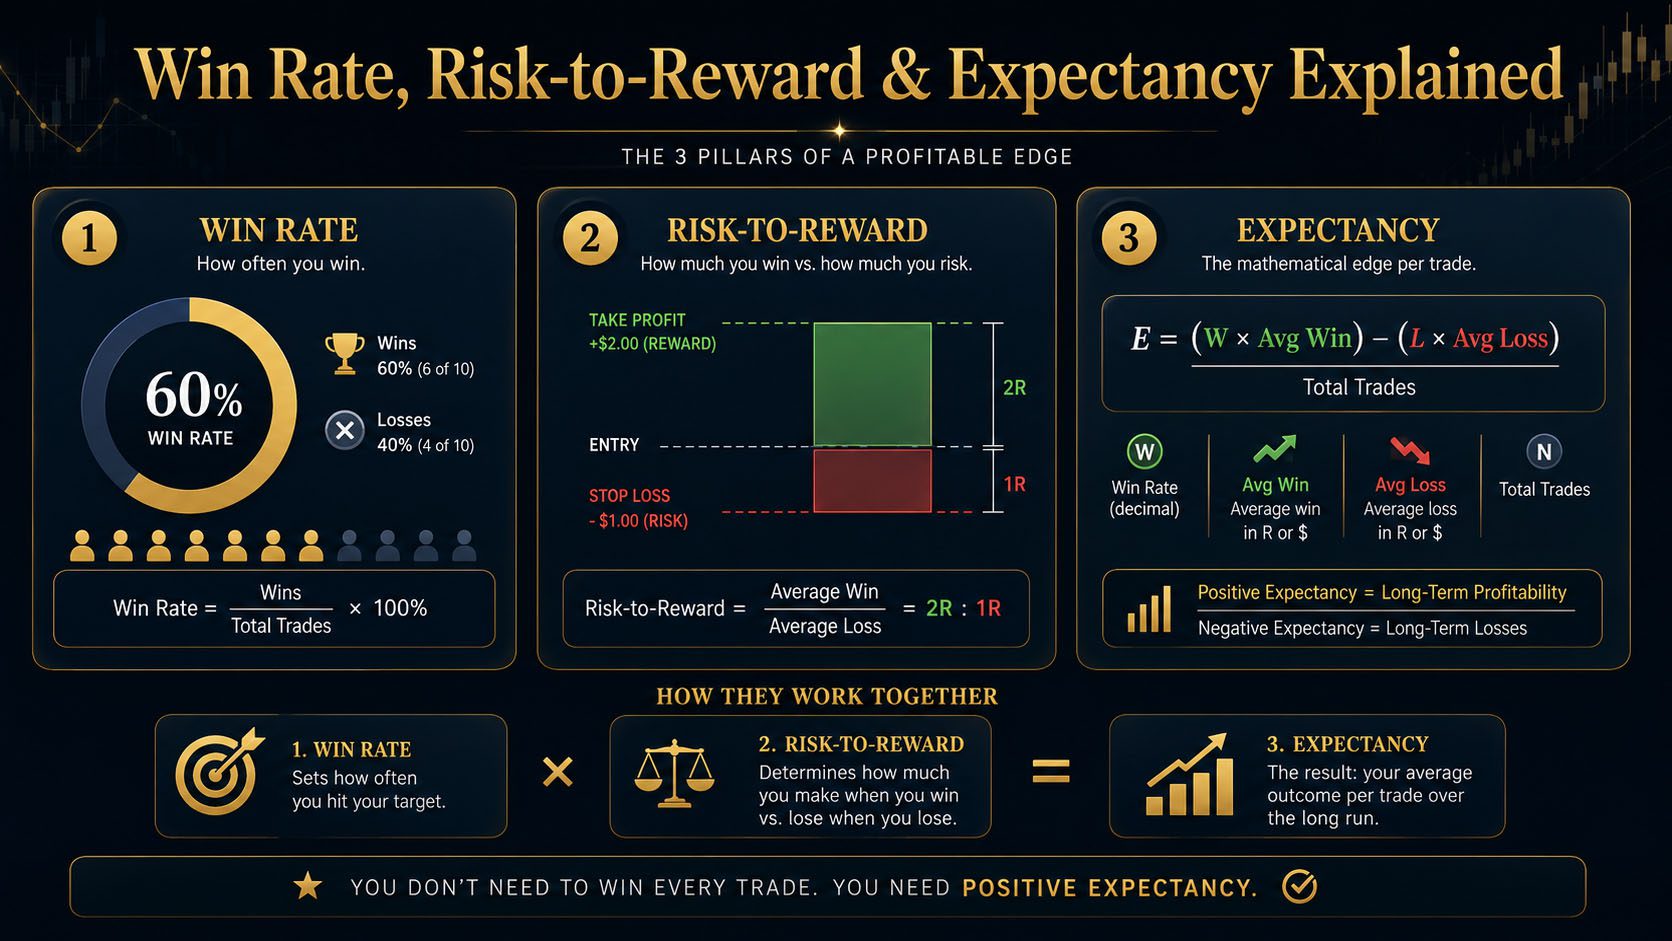
10. Win Rate
Win rate is the percentage of completed trades that produced a profit.
Win Rate = Winning Trades ÷ Total Trades × 100
A strategy with 60 wins out of 100 trades has a 60% win rate. Win rate is useful, but it does not tell the full story. A high win rate can still lose money if losses are much larger than wins.
Do not judge a strategy only by win rate. A strategy can win 80% of the time and still fail if the remaining losses are uncontrolled.
11. Average Win and Average Loss
Average Win
Add the profit from all winning trades and divide by the number of winners.Average Win = Total Winning R ÷ Number of Wins
Average Loss
Add the loss from all losing trades and divide by the number of losses.Average Loss = Total Losing R ÷ Number of Losses
12. Expectancy: The Most Important Number
Expectancy estimates how much a strategy earns or loses on average per trade over a large sample.
Expectancy = (Win Rate × Average Win) − (Loss Rate × Average Loss)
Example
- Win rate: 45%
- Average win: 2.2R
- Loss rate: 55%
- Average loss: 1R
Expectancy = (0.45 × 2.2) − (0.55 × 1) = +0.44R per trade
This means the strategy historically produced an average of 0.44R per trade. It does not mean every trade earns 0.44R. Individual results will vary.
Positive expectancy matters more than having an impressive win rate.
13. Maximum Drawdown
Maximum drawdown is the largest decline from an account peak to a later low during the test. It reveals how much pain the strategy may experience before recovering.
Why Drawdown Matters
- It helps determine safe risk per trade.
- It shows whether the strategy fits prop firm limits.
- It reveals the effect of losing streaks.
- It helps evaluate psychological suitability.
- It exposes overly aggressive position sizing.
A profitable strategy can still be unusable if its drawdown exceeds your account limits or emotional tolerance.
14. Consecutive Losses
Every strategy can experience losing streaks. Your test should identify the longest historical sequence of losses and help you prepare for a similar or larger streak in the future.
Example
If a strategy historically produced seven consecutive losses and you risk 2% per trade, the account could lose approximately 14% before compounding effects and slippage. That may be unacceptable for a prop firm account.What to Record
- Maximum consecutive losses.
- Maximum consecutive wins.
- Average length of losing streaks.
- Recovery time after drawdown.
- Whether losses cluster during certain conditions.
Your risk level should be based on the strategy’s losing streaks—not on the confidence created by its best month.
15. Profit Factor
Profit factor compares total gross profit with total gross loss.
Profit Factor = Total Gross Profit ÷ Total Gross Loss
| Profit Factor | General Interpretation |
|---|---|
| Below 1.00 | The strategy lost more than it earned during the sample. |
| 1.00 | Gross profit approximately equaled gross loss. |
| 1.20–1.40 | Potential edge, but may be sensitive to costs and execution. |
| 1.50–2.00 | Stronger historical performance. |
| Above 2.00 | Excellent historical performance, but verify sample quality and overfitting. |
An unusually high profit factor from a small sample may be luck rather than a durable edge.
16. Track Results by Market Condition
A strategy may perform well overall but poorly in one specific environment. Separate your results into categories.
Useful Categories
- Trending market vs ranging market.
- London vs New York session.
- High volatility vs low volatility.
- Long trades vs short trades.
- Breakout entries vs retest entries.
- News days vs normal days.
- Monday, Tuesday, Wednesday, Thursday, and Friday.
- Different currency pairs.
The strongest improvements often come from removing weak conditions rather than adding more entry indicators.
17. Avoid Hindsight Bias
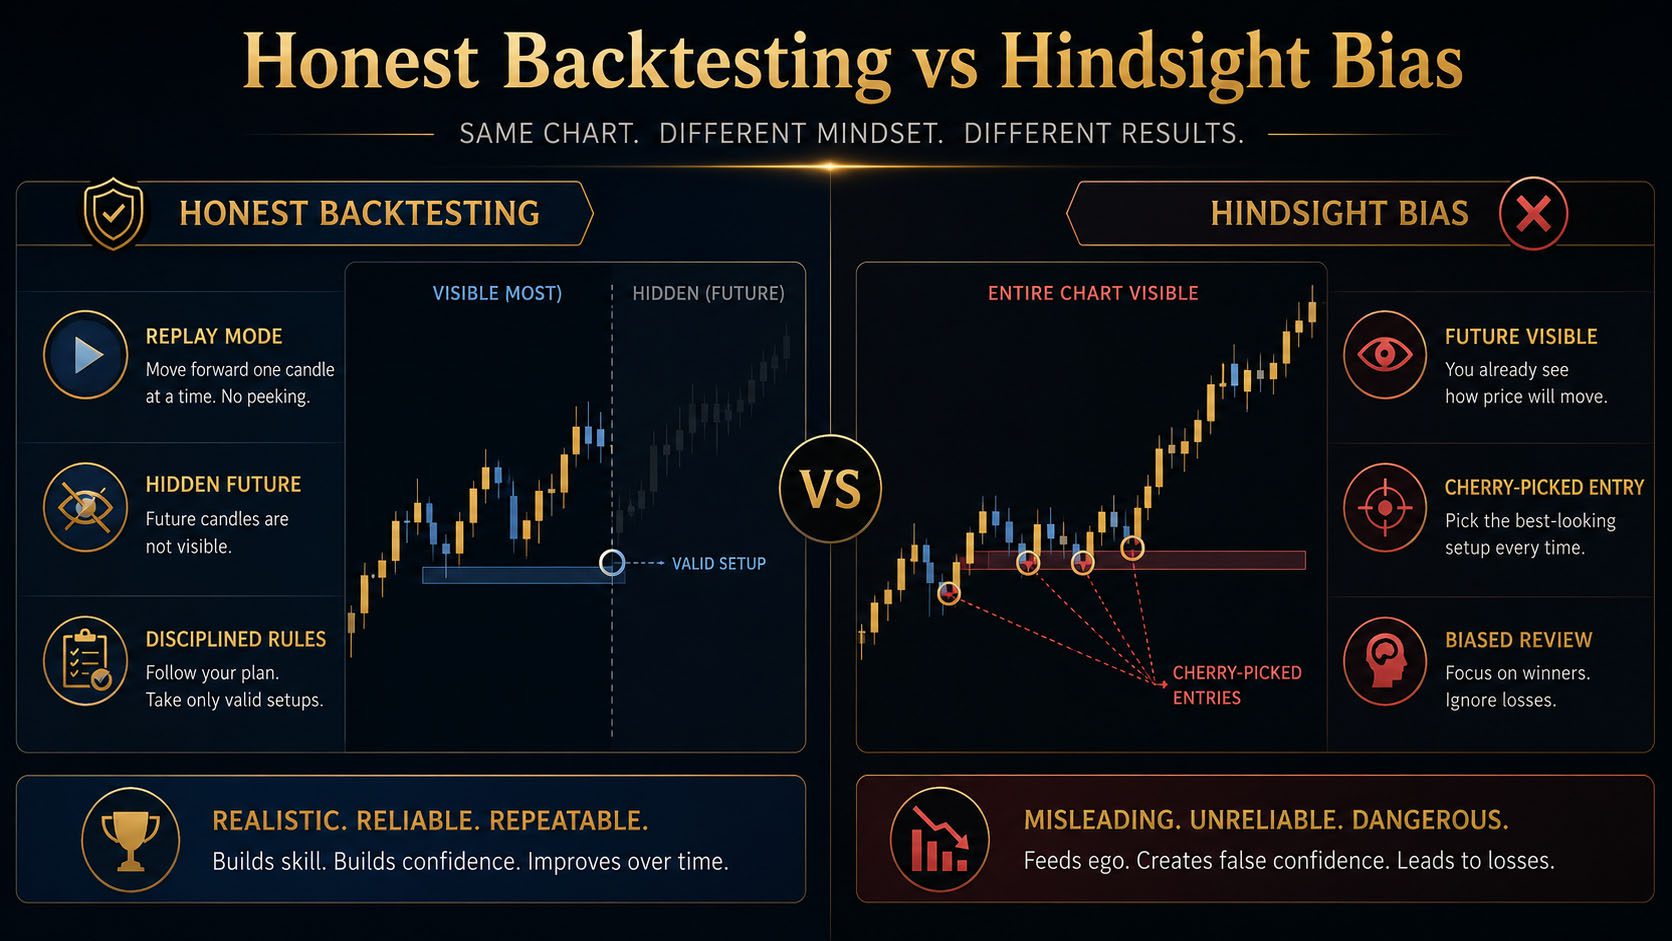
Hindsight bias occurs when the outcome influences how you interpret the setup. After seeing price rise, the bullish clues appear obvious. After seeing price fall, the bearish clues appear obvious.
Common Signs of Hindsight Bias
- Skipping losing setups that technically qualified.
- Taking winning setups that did not meet all rules.
- Adjusting the entry after seeing the move.
- Choosing the perfect stop after viewing the low.
- Moving the target to the exact historical high.
- Explaining every result after it happens.
How to Reduce It
- Use replay mode.
- Advance one candle at a time.
- Write the trade decision before revealing future candles.
- Use fixed entry, stop, and target rules.
- Record every valid setup.
18. Avoid Overfitting
Overfitting occurs when a strategy is adjusted so precisely to historical data that it loses the ability to perform in new conditions.
Examples of Overfitting
- Testing dozens of indicator settings and choosing only the best result.
- Adding a new filter after every losing trade.
- Creating different rules for every month.
- Removing trades only because they lost.
- Building a strategy around one exceptional market period.
- Using too many variables with too little data.
The more perfectly a strategy explains the past, the more suspicious you should become unless it also performs on unseen data.
Better Approach
- Keep rules simple.
- Use broad logical concepts.
- Test on multiple periods.
- Separate development data from validation data.
- Change one variable at a time.
- Require improvement across more than one market condition.
19. In-Sample vs Out-of-Sample Testing
In-Sample Data
This is the historical data used to build and refine the strategy. You may identify useful filters and improve unclear rules during this stage.Out-of-Sample Data
This is separate historical data that was not used during development. It tests whether the strategy can perform on unseen conditions.Example Testing Split
- Development period: January 2023 through December 2024.
- Validation period: January 2025 through December 2025.
- Forward test: New market data after the historical test ends.
Do not repeatedly redesign the strategy using the out-of-sample results. Once you do that, the validation data becomes development data.
20. Include Realistic Trading Costs
A theoretical result can look profitable before spread, commissions, slippage, and swap charges are included. Small costs matter, especially for short-term strategies.
Costs to Consider
- Bid-ask spread.
- Broker commission.
- Slippage on entries and exits.
- Swap or overnight financing.
- Data or platform fees.
- Prop firm commissions and rules.
A strategy with a small edge may become unprofitable after realistic trading costs are included.
21. Forward Testing Process
1
Use the Final Rules
Do not continue changing the strategy during every live session.2
Use Realistic Execution
Enter at prices that could actually be achieved.3
Record Everything
Track valid trades, missed trades, mistakes, and market conditions.4
Compare Results
Measure whether forward performance resembles historical performance.Recommended Forward Testing Sequence
- Begin with a simulator or demo account.
- Follow the same trading window every day.
- Risk a fixed theoretical amount.
- Record entries at executable prices.
- Include spread and commission.
- Document emotional and execution mistakes.
- Complete a meaningful sample before judging the strategy.
22. Backtest Result vs Live Result
| Difference | Backtest | Forward Test |
|---|---|---|
| Entry precision | May assume ideal entry | Includes delays, spread, and missed fills |
| Psychology | Minimal emotional pressure | Fear, greed, hesitation, and impatience appear |
| Chart visibility | Risk of seeing future data | Future outcome is unknown |
| Trading costs | Sometimes ignored | Actual spread and commission are visible |
| Missed setups | Every setup can be recorded | Work, sleep, and distractions may cause missed trades |
| Execution consistency | Rules can be applied perfectly | Trader discipline becomes part of the result |
23. Strategy Performance vs Trader Performance
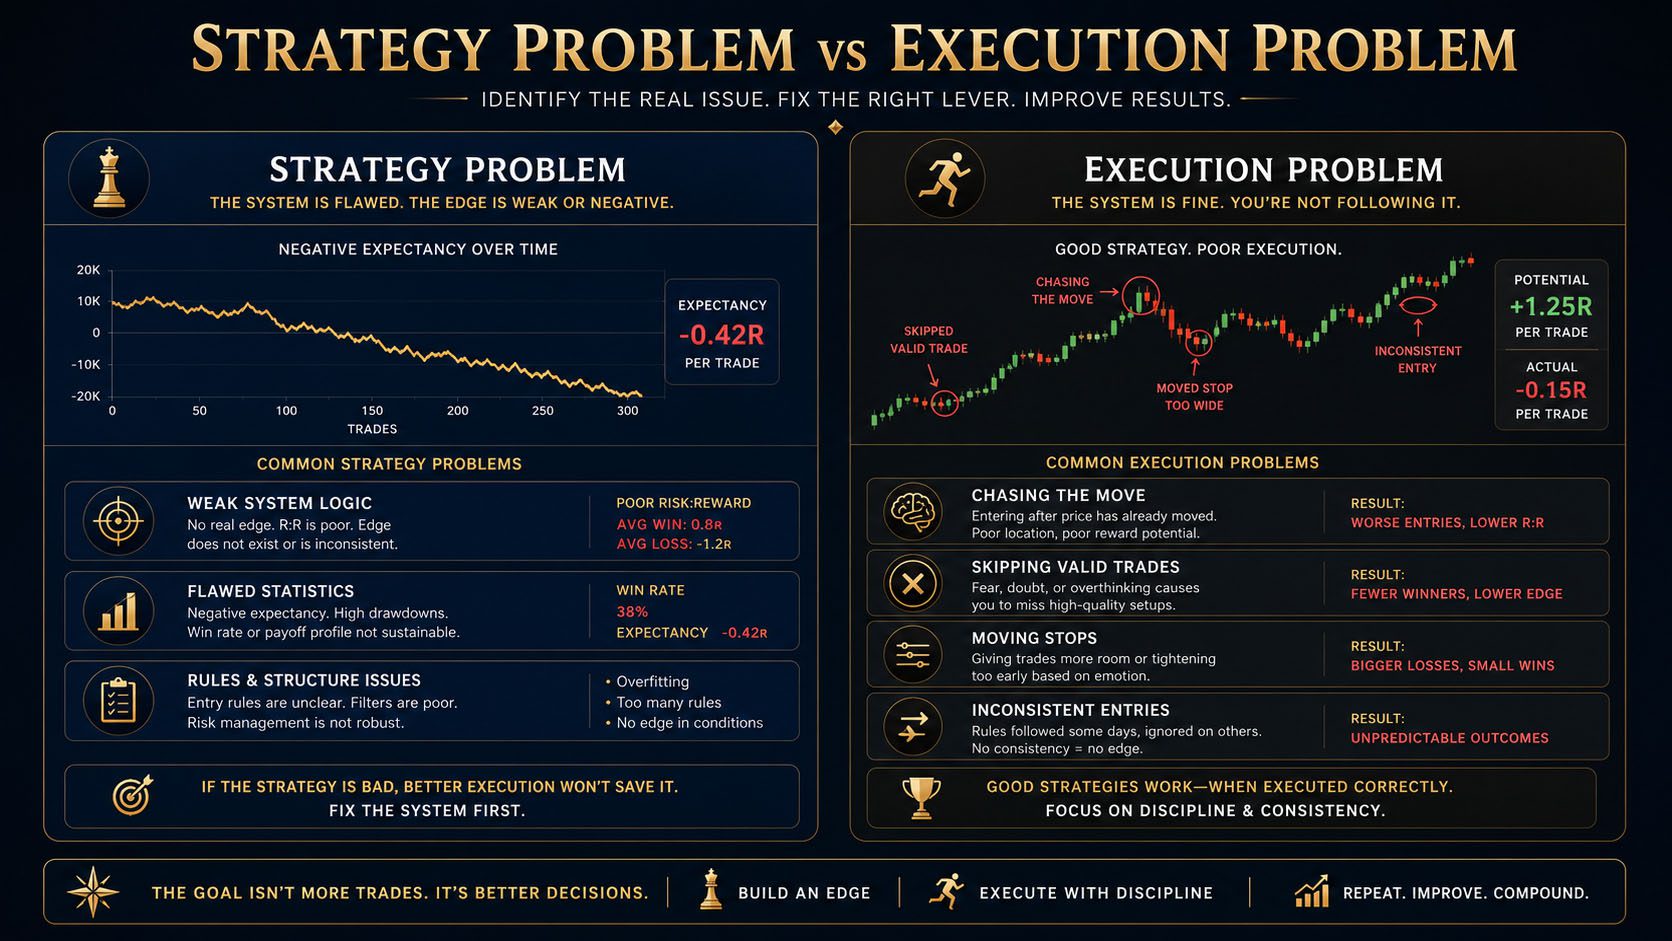
Strategy Problem
- Rules were followed consistently.
- Performance remains negative.
- Losses occur across multiple conditions.
- Expectancy is negative after costs.
- Drawdown is structurally too high.
Execution Problem
- Valid trades were skipped.
- Losing trades were chased.
- Risk was inconsistent.
- Stops and targets were changed emotionally.
- Trades were entered outside the planned session.
24. How to Review Your Data
Questions to Ask
- Is expectancy positive after realistic costs?
- Is the drawdown acceptable?
- Is the sample large enough?
- Does the strategy perform across more than one month?
- Which market conditions produce the strongest results?
- Which conditions should become no-trade filters?
- Are long and short trades equally effective?
- Does performance change by session?
- Are losses caused by the strategy or execution?
- Can the rules be followed without confusion?
Your review should produce fewer, clearer rules—not a complicated collection of exceptions.
25. When Should You Change a Strategy?
A strategy should not be changed after every loss. Changes require evidence.
A Change May Be Justified When
- A large sample shows negative expectancy.
- One market condition consistently produces losses.
- The stop rule creates repeated avoidable losses.
- The target is rarely reached despite strong entries.
- Trading costs remove the historical edge.
- The rules are too subjective to execute consistently.
- Forward results differ materially from historical results.
Professional Change Process
- Identify one specific weakness.
- Propose one logical adjustment.
- Retest the full historical sample.
- Compare old and new results.
- Forward test the revised rules.
- Do not combine results from different versions.
26. Prop Firm Testing Considerations
A strategy intended for prop firm trading must be tested against the firm’s rules, not only for profitability.
Test These Restrictions
- Daily drawdown limits.
- Maximum total drawdown.
- Static vs trailing drawdown.
- News-trading restrictions.
- Weekend holding rules.
- Consistency rules.
- Maximum position size.
- Minimum trading days.
- Payout requirements.
A strategy can be profitable and still be unsuitable for a prop firm challenge if its normal drawdown violates the firm’s limits.
Review Common Rules That Get Traders Disqualified.
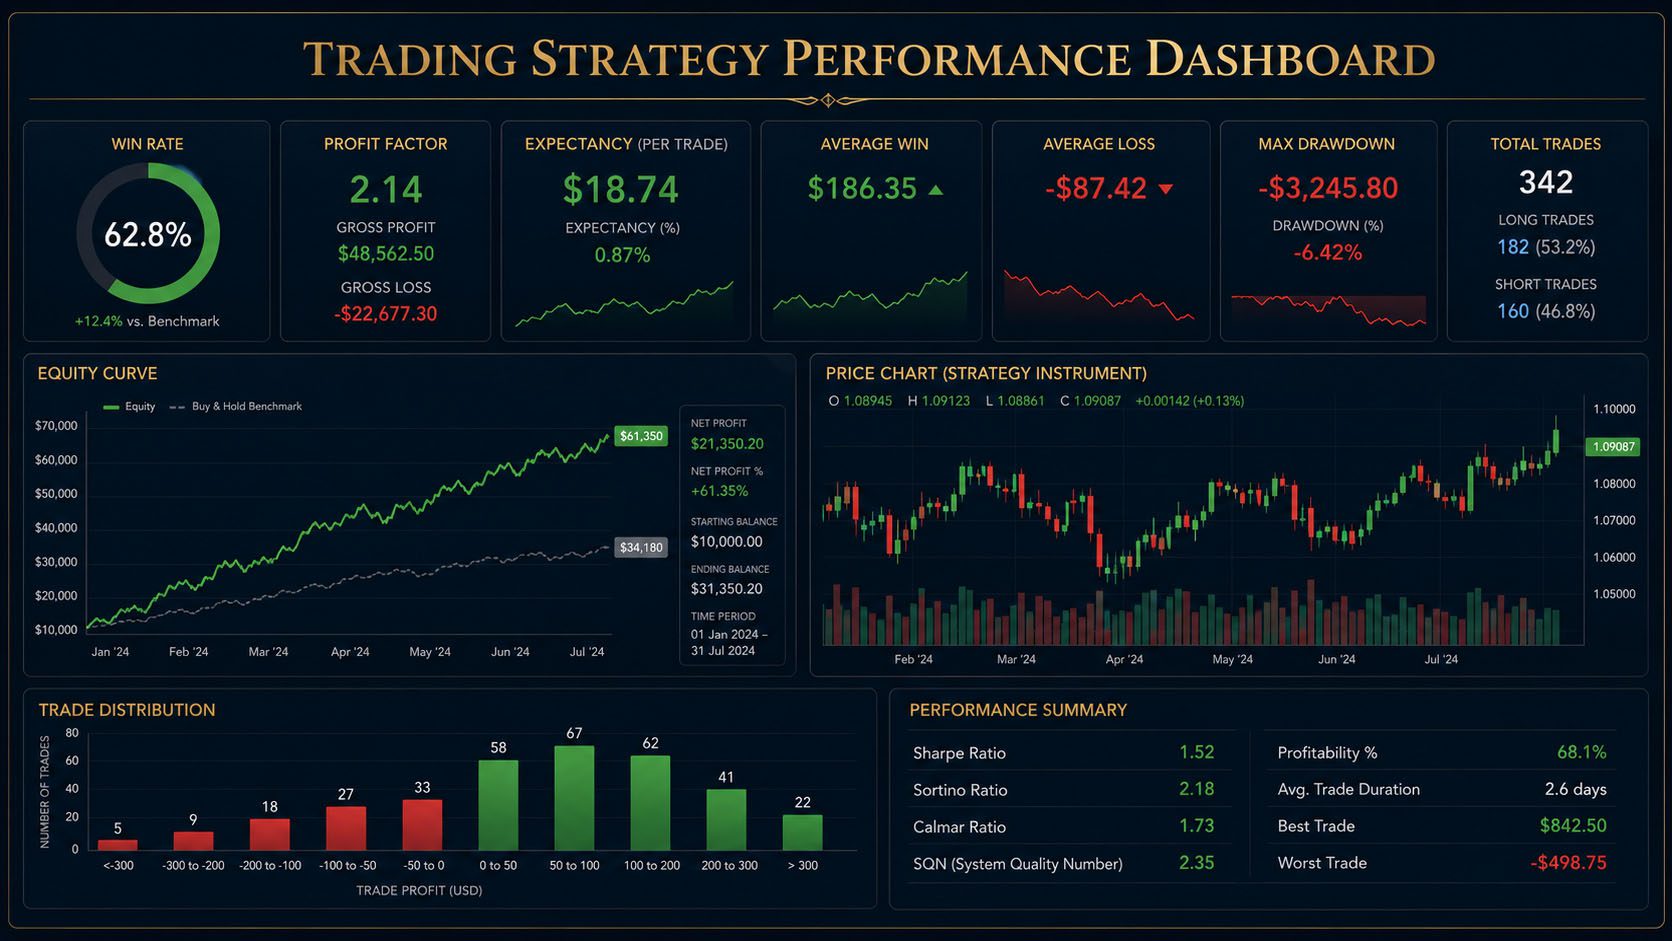
27. Example Backtest Summary
London Trend Pullback Strategy
120Total trades
47%Win rate
2.1RAverage winner
1RAverage loser
+0.46RExpectancy per trade
1.72Profit factor
8RMaximum drawdown
6Maximum consecutive losses
Interpretation
The strategy has a win rate below 50%, but the average winner is more than twice the average loss. Historical expectancy is positive. The trader must be psychologically and financially prepared for at least six consecutive losses and a drawdown larger than the historical maximum.
28. When Is a Strategy Ready for Live Trading?
- The rules are written clearly and objectively.
- The backtest contains a meaningful sample.
- The strategy has positive expectancy after costs.
- The drawdown fits the account limits.
- The strategy performs on out-of-sample data.
- Forward testing broadly supports the historical results.
- The trader can execute the strategy consistently.
- Risk per trade has been calculated from real drawdown data.
- No-trade conditions are clearly defined.
- The trader accepts the expected losing streaks.
A strategy is not ready because you feel confident. It is ready when the rules, data, execution, and risk controls support that confidence.
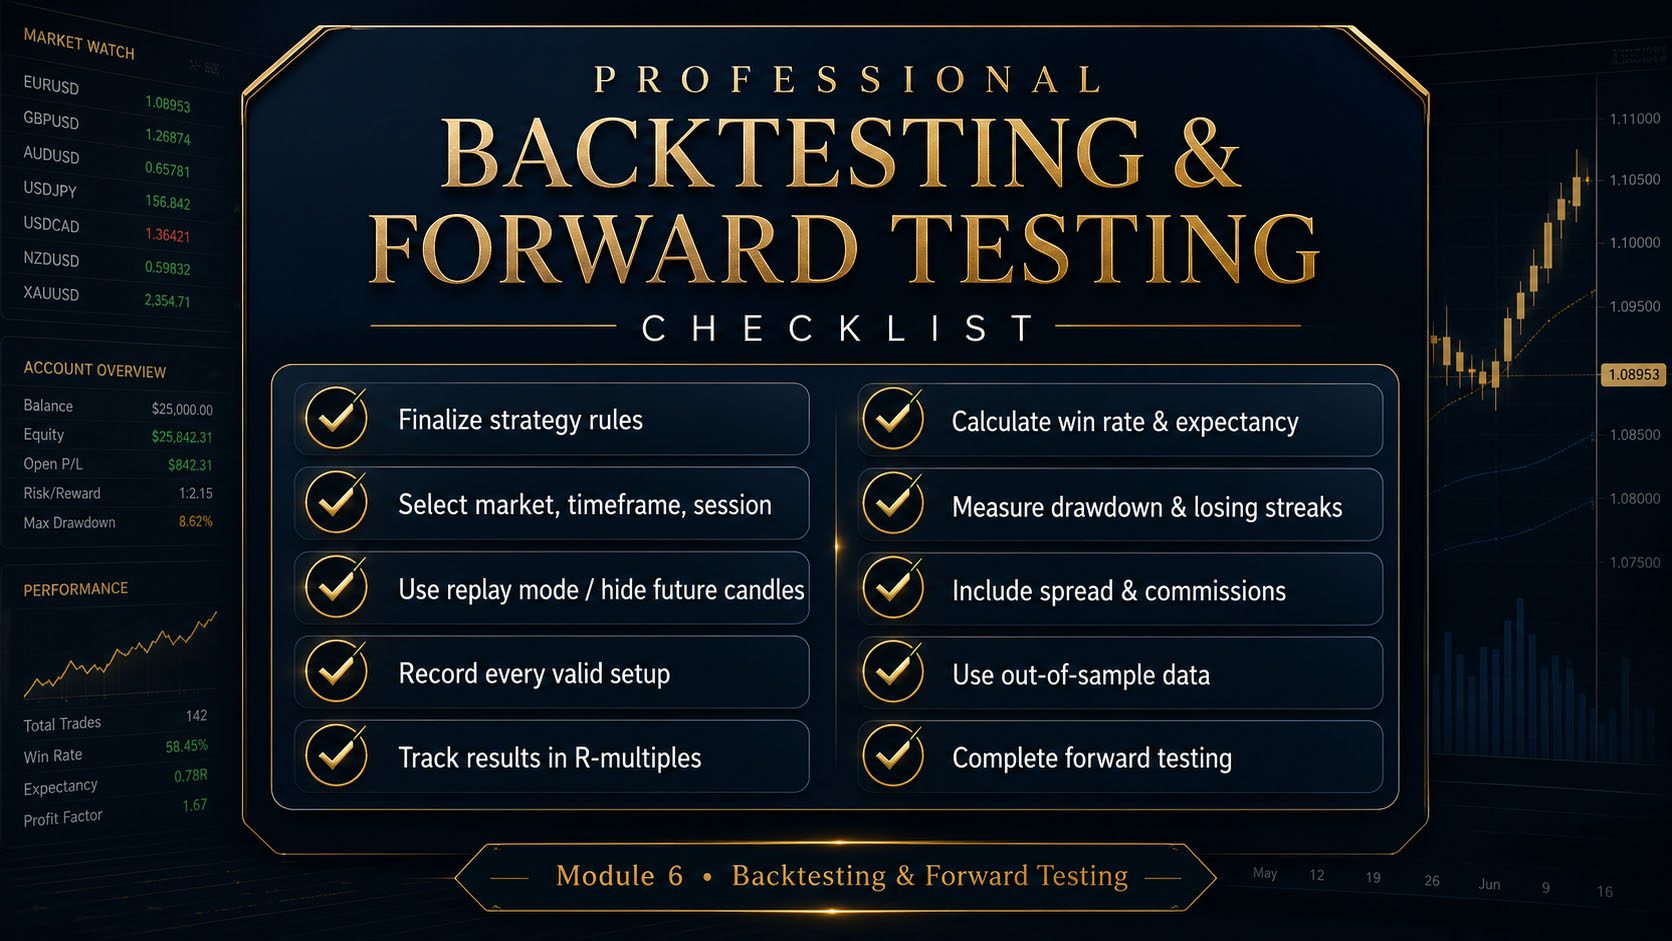
29. Professional Testing Checklist
- I finalized the strategy rules before testing.
- I selected the instrument, timeframe, session, and date range.
- I used replay mode or hidden future candles.
- I recorded every valid setup.
- I included wins, losses, break-even trades, and missed trades.
- I recorded results in R-multiples.
- I calculated win rate, average win, and average loss.
- I calculated expectancy and profit factor.
- I measured maximum drawdown and losing streaks.
- I separated results by market condition and session.
- I included spread, commission, and realistic execution.
- I used out-of-sample data.
- I completed forward testing.
- I separated strategy losses from execution mistakes.
- I changed rules only when the data justified it.
Frequently Asked Questions
How many trades should I backtest?
One hundred trades is a useful beginner target, but more trades generally provide stronger evidence. The rules must remain consistent throughout the sample.Can backtesting guarantee that a strategy will work?
No. Backtesting shows how the rules performed historically. Market conditions, costs, and execution can change.Should I include break-even trades?
Yes. Break-even results affect expectancy and reveal whether your management rules are helping or hurting performance.What is more important: win rate or expectancy?
Expectancy is more complete because it combines win rate, average win, average loss, and loss rate.How long should I forward test?
Forward testing should continue until you have a meaningful sample across different conditions. Depending on setup frequency, this may take several weeks or months.Can I change rules during forward testing?
Not casually. Record observations first. If a change appears justified, create a new strategy version and test it separately.Why are my live results worse than my backtest?
Common causes include spread, slippage, missed trades, emotional decisions, hindsight bias in the historical test, and inconsistent live execution.Knowledge Check Quiz
1. What is the primary purpose of backtesting?
2. Why should future candles be hidden?
3. What does positive expectancy mean?
4. What is overfitting?
5. What does forward testing measure that backtesting may not?
6. When should a strategy rule be changed?
Quiz Answer Key
Question 1 Answer
B. Backtesting measures how fixed strategy rules performed on historical market data.Question 2 Answer
A. Hiding future candles prevents the outcome from influencing the trade decision.Question 3 Answer
B. Positive expectancy means the strategy historically produced a positive average result per trade.Question 4 Answer
B. Overfitting occurs when rules are adjusted too closely to past data and fail on new conditions.Question 5 Answer
B. Forward testing includes live execution, spread, timing, missed trades, and psychological pressure.Question 6 Answer
C. Strategy rules should change only when a meaningful body of evidence supports the adjustment.Key Takeaways
What You Must Remember
- A strategy is only an idea until it has been tested.
- Backtesting uses historical data; forward testing uses new data.
- Rules must remain fixed during each test version.
- Every valid setup must be recorded.
- Use R-multiples to compare trades objectively.
- Win rate alone does not determine profitability.
- Expectancy combines win rate, average win, and average loss.
- Drawdown and losing streaks determine safe risk.
- Replay mode helps reduce hindsight bias.
- Simple rules reduce overfitting.
- Include real trading costs.
- Separate strategy problems from execution problems.
- Change rules only when reliable data supports the change.
- Forward testing must confirm that the strategy is practical.
Lesson Summary
Backtesting and forward testing transform a trading strategy from an unproven idea into a measurable decision-making system. Backtesting reveals how the rules behaved historically, while forward testing shows whether the strategy and trader can perform under realistic conditions.
A professional test records every valid setup, measures results in R, calculates expectancy and drawdown, includes trading costs, and evaluates performance across different market conditions.
The objective is not to create perfect historical results. The objective is to understand the strategy’s strengths, weaknesses, risk, losing streaks, and realistic potential.
In the final lesson of Module 6, you will combine the complete execution process into a professional trade execution checklist and review the major principles from the entire module.